Publications
While a comprehensive view of our publications, presentations, and patents, including the latest updates, can be obtained from the Google Scholar page of the PI Ganguly (as well as from his CV) a few samples are provided below.
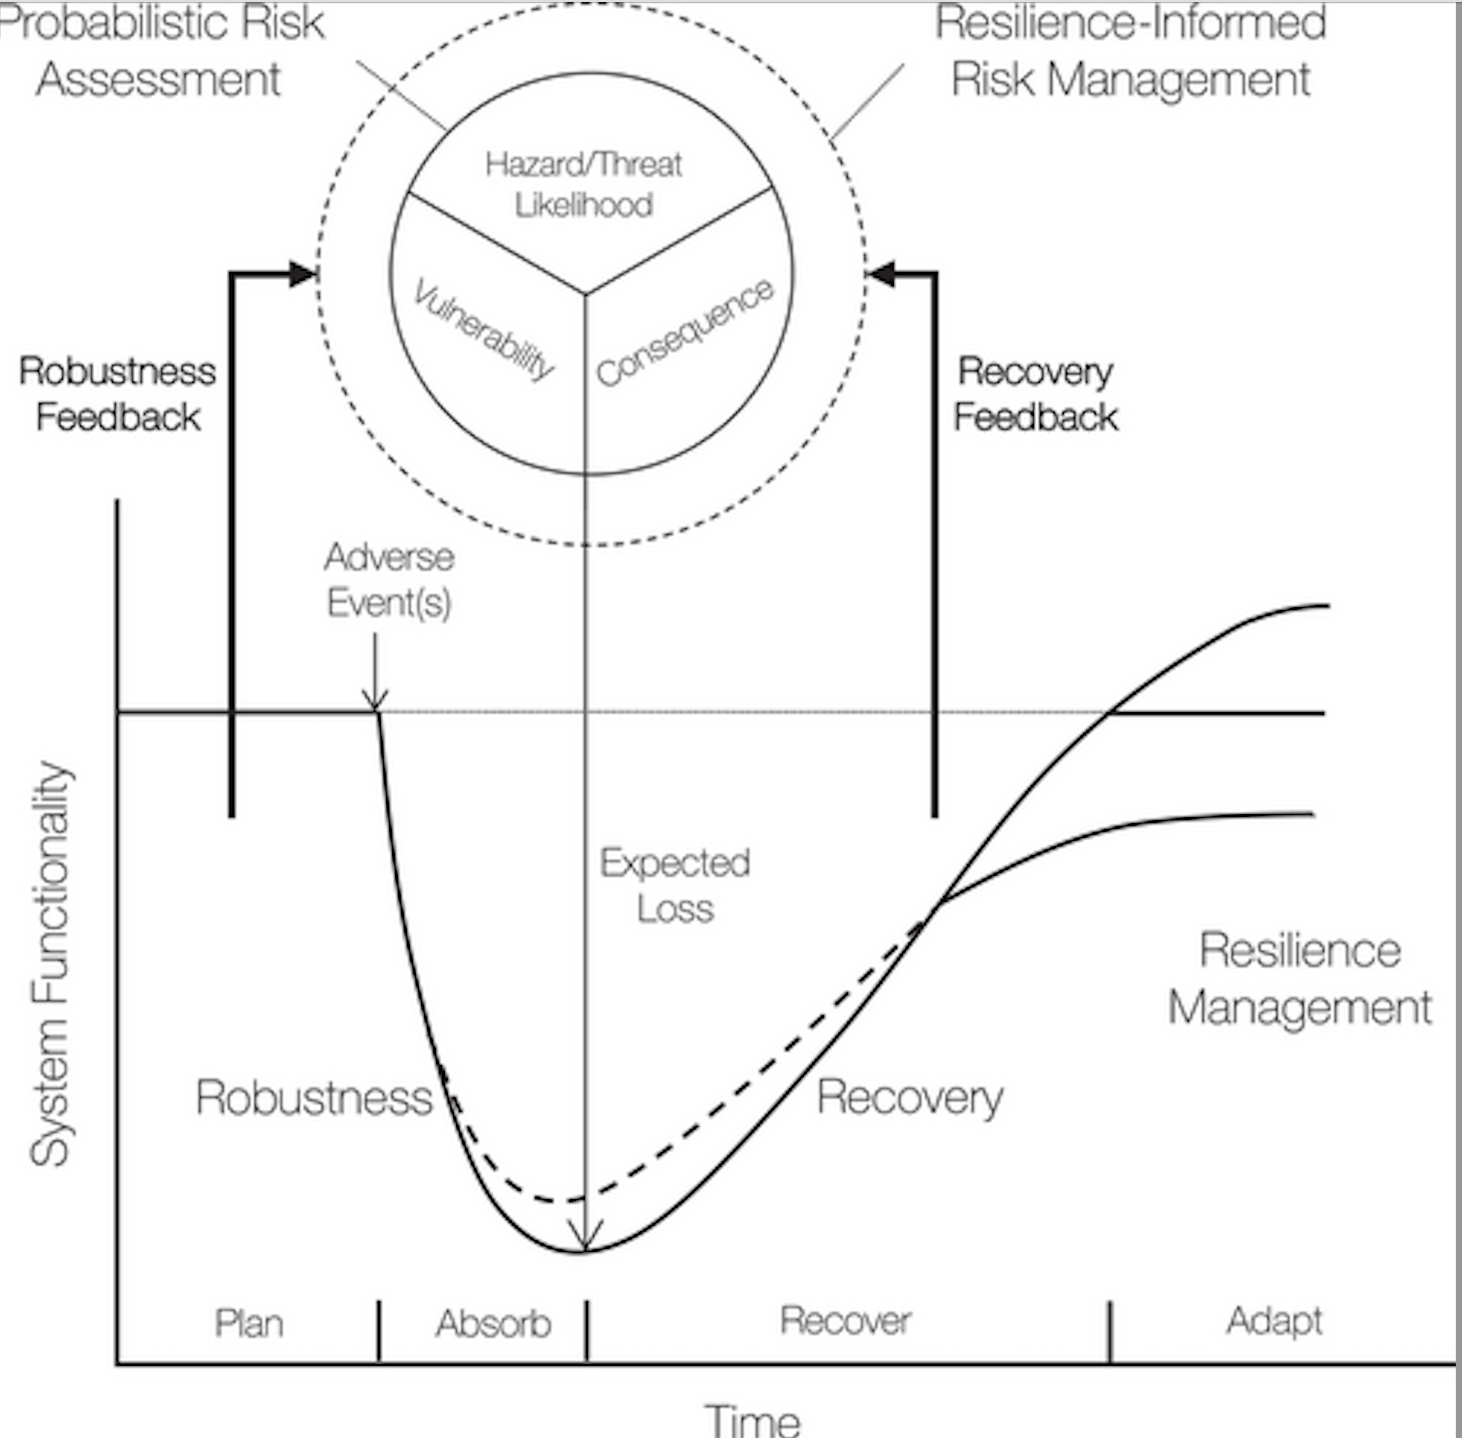
Increase in compound natural and man-made extreme events, and growing interconnectedness of critical societal functions emphasize further understanding of interactions between elements of risk and resilience. While conceptual frameworks have mapped quantified risks to the failure of critical societal functions, feedback from failure and recovery pathways to management of risk has not been systematically considered yet. In this brief perspective, we revisit the risk-resilience feedback paradigm in the context of connected critical societal functions and discuss its role in advancing science-informed disaster policy development. Specifically, we focus on connecting robustness and recovery elements of resilience to the management of risk elements, including threat, vulnerability, and consequence. Furthermore, we briefly describe a notional networked supply chain system example to illustrate how robustness and recovery measures can inform elements of risk. Understanding interactions between elements of risk and resilience is not a fully solved problem. Extending these concepts in the context of connected natural-built-human systems subject to compound and cascading risks is an open challenge. This discussion represents steps toward addressing these challenges.
Samrat Chatterjee, Auroop Ganguly, Dennis Thomas, Lauren Wind
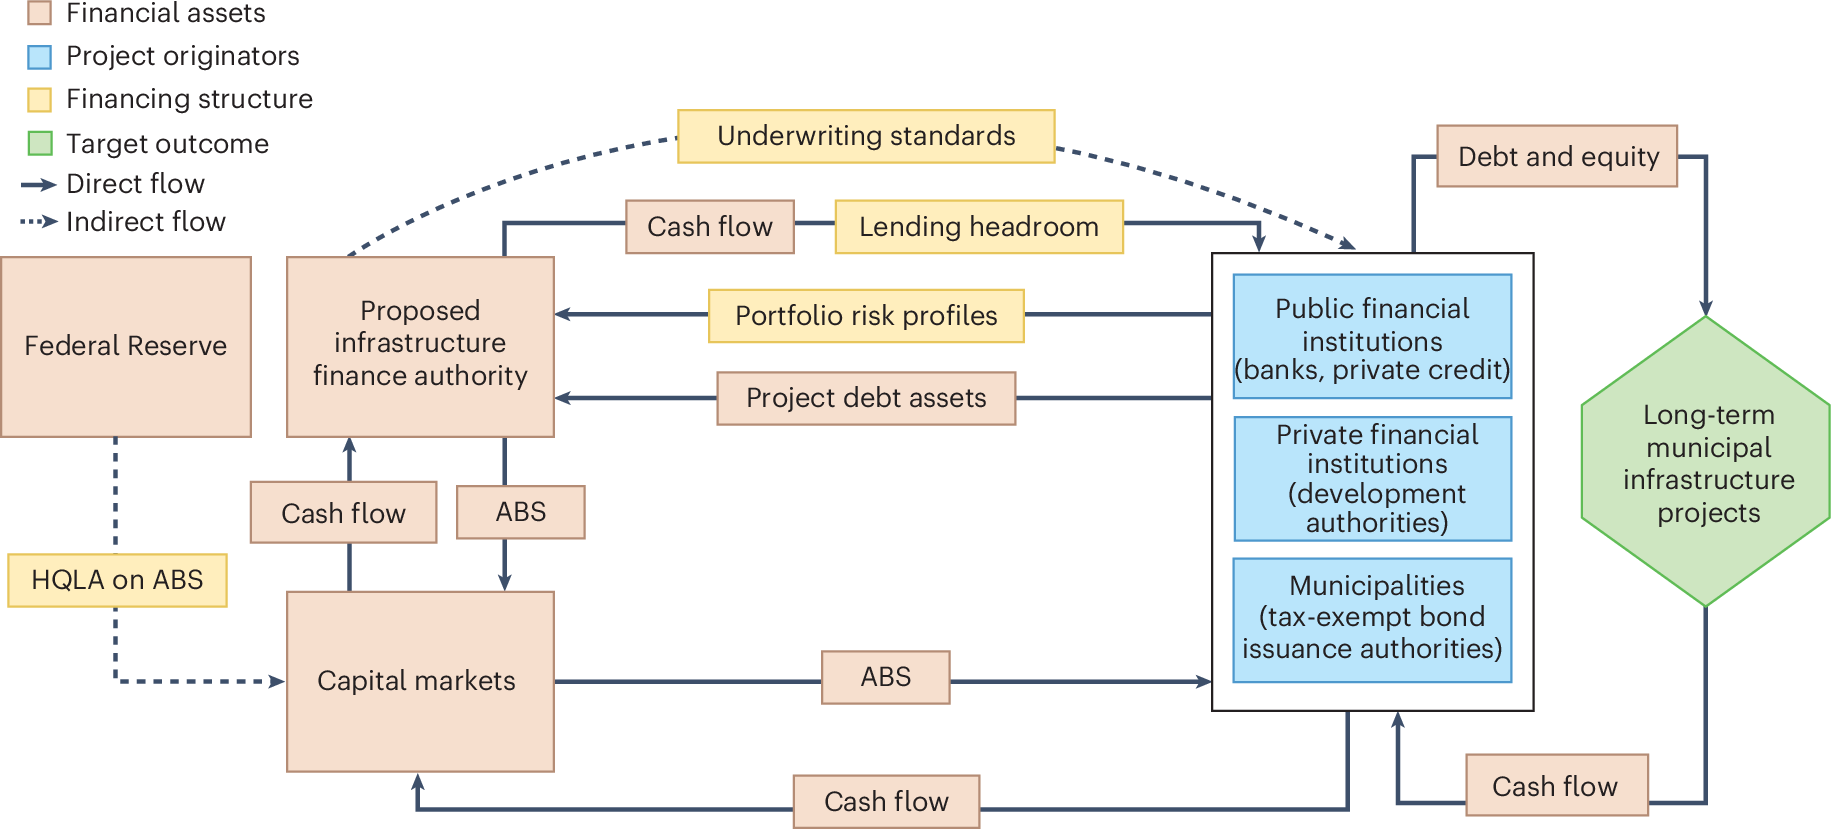
The US $4.2 trillion US municipal debt market finances over 70% of essential infrastructure, but escalating physical climate risks, such as flooding and wildfires, are exposing the market’s emerging vulnerabilities. Rising disaster costs and insurance retreat threaten property values, and hence municipal tax bases that secure debt repayment. Despite these signals, municipal bond prices have been slow to reflect climate risk adequately. Well-resourced municipalities may use bonds for adaptation, but those facing constrained credit access may struggle to access capital. This US-focused Review identifies three challenges: (1) climate risk is underpriced in municipal bonds; (2) abrupt repricing could affect high-risk and under-resourced cities most by increasing borrowing costs and limiting capital access; (3) misalignment between adaptation planning and municipal finance weakens long-term resilience and affects creditworthiness. Together, these challenges contribute to a climate-debt doom loop that can be triggered by climate shocks. This synthesis offers actionable strategies for cities’ adaptation plans and governance frameworks to disrupt this loop and strengthen municipalities’ financial resilience.
Aayushi Mishra, Advait Arun, Evan Kodra, Erika Smull, Owen Woolcock, Tom Doe, Justin Marlowe, Auroop R. Ganguly
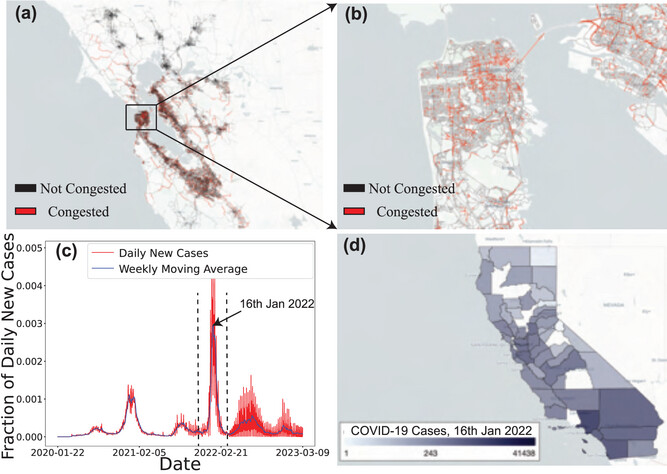
Modeling spreading dynamics on spatial networks is crucial to addressing challenges related to traffic congestion, epidemic outbreaks, efficient information dissemination, and technology adoption. Existing approaches include domain-specific agent-based simulations, which offer detailed dynamics but often involve extensive parameterization, and simplified differential equation models, which provide analytical tractability but may abstract away spatial heterogeneity in propagation patterns. As a step toward addressing this trade-off, this work presents a hierarchical multiscale framework that approximates spreading dynamics across different spatial scales under certain simplifying assumptions. Applied to the Susceptible-Infected-Recovered (SIR) model, the approach ensures consistency in dynamics across scales through multiscale regularization, linking parameters at finer scales to those obtained at coarser scales. This approach constrains the parameter search space, and enables faster convergence of the model fitting process compared to the non-regularized model. Using hierarchical modeling, the spatial dependencies critical for understanding system-level behavior are captured while mitigating the computational challenges posed by parameter proliferation at finer scales. Considering traffic congestion and COVID-19 spread as case studies, the calibrated fine-scale model is employed to analyze the effects of perturbations and to identify critical regions and connections that disproportionately influence system dynamics. This facilitates targeted intervention strategies and provides a tool for studying and managing spreading processes in spatially distributed sociotechnical systems.
Aparimit Kasliwal, Abdullah Alhadlaq, Ariel Salgado, Auroop R. Ganguly, Marta C. González
Computer-Aided Civil and Infrastructure Engineering, 2025
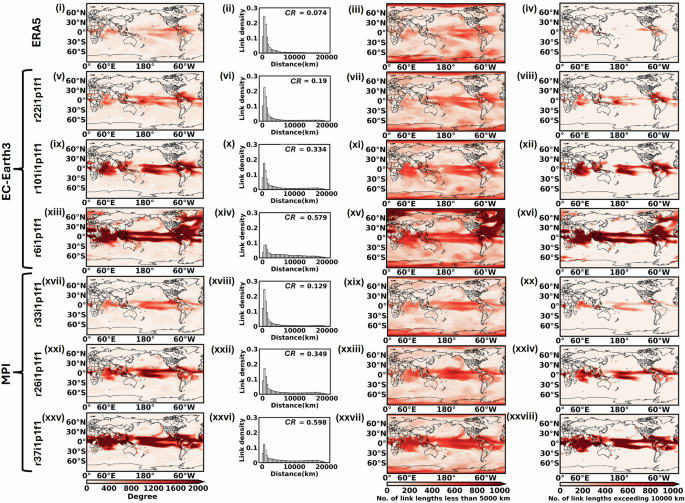
A comprehensive characterization of internal climate variability (ICV) in initial-condition (IC) large ensembles of Earth system models (ESMs) remains a significant challenge in climate science. In this study, we leverage the spatial connectivity structures of temperature networks to characterize ICV, observing substantial differences across ensemble members, particularly in the prevalence of long-range connections. Based on this feature, we introduce the ‘Connectivity Ratio’ (CR), a new quantifier that captures long-range spatial connectivity within climate networks. CR is applied to two ESMs, EC-Earth3 and MPI-ESM1-2-LR, to evaluate structural variability across IC ensemble members, models, and climate time horizons. CR reveals systematic differences in long-range connectivity between forced and unforced simulations, as well as across future climate periods. As such, CR provides an interpretable measure for capturing ICV across ensemble members and models. It has the potential to support the quantification of irreducible uncertainty and contributes to a robust evaluation of climate models.
Arnob Ray, Abhirup Banerjee, Rachindra Mawalagedara & Auroop R. GangulyArnob Ray, Abhirup Banerjee, Rachindra Mawalagedara, Auroop R. Ganguly
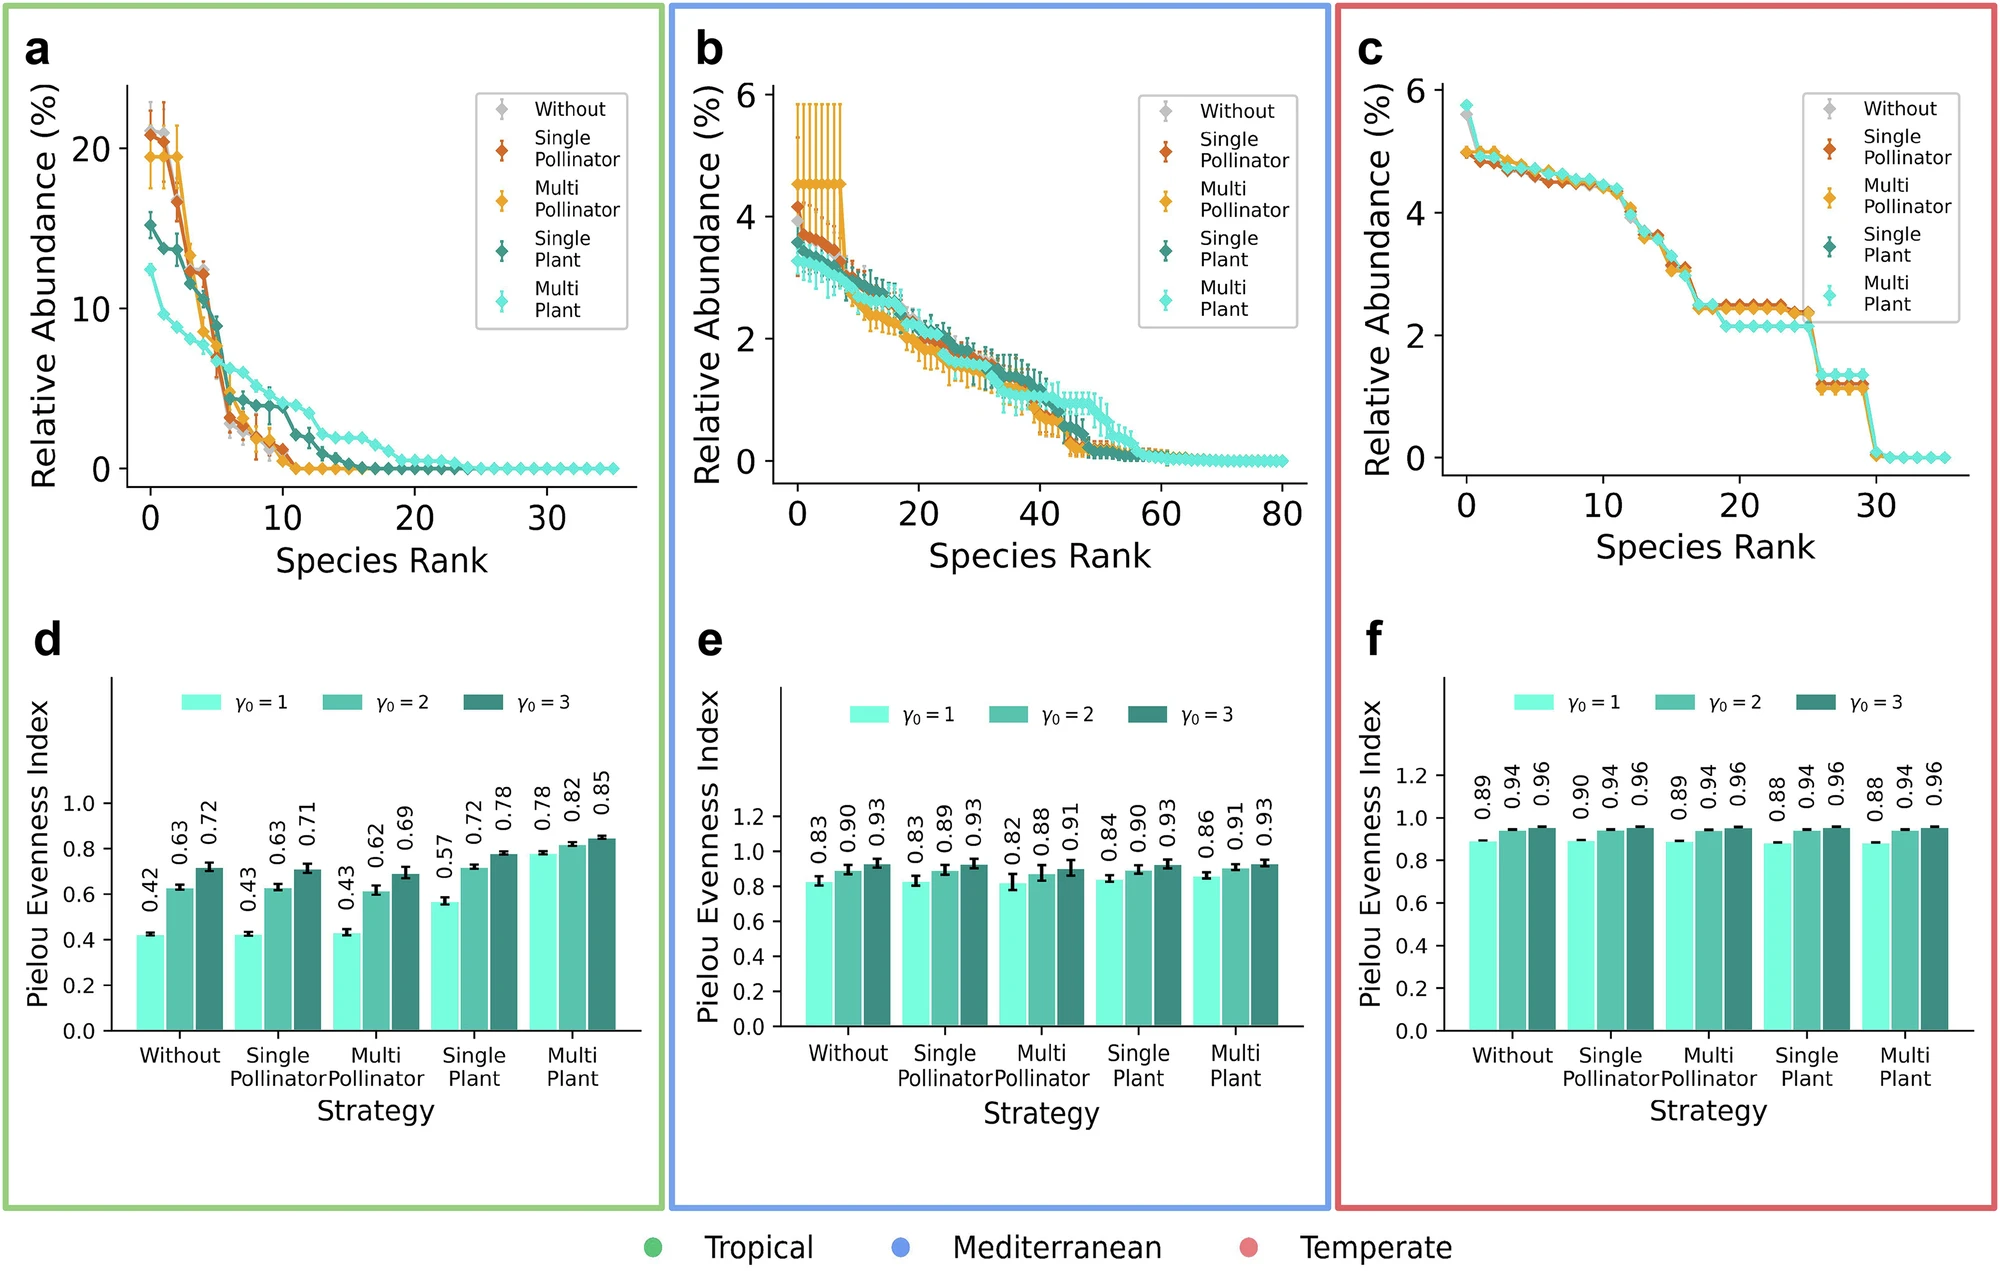
Mitigating the deleterious effects of warming is critical to ensure the persistence of plant-pollinator systems. Previous research relying on single-species frameworks has highlighted the conservation implications of universal increases in extinction risk due to warming, yet effective management approaches that incorporate the role of complex species interaction networks remain poorly understood. Here, we integrate monthly temperature projections with region-specific thermal-performance parameters to simulate population dynamics in 11 plant-pollinator networks across tropical, temperate, and Mediterranean ecosystems. Our results show that tropical networks that are near their thermal limits face pronounced pollinator declines (~50%) but that multi-species management targeting keystone plants offsets these effects by boosting both pollinator abundance and evenness. In contrast, temperate networks remain below critical temperature thresholds, with minimal pollinator declines (~5%) and marginal gains from management. These findings highlight the importance of considering the environmental and ecological contexts when attempting to manage ecosystems under climate change.
Adrija Datta, Sarth Dubey, Tarik C. Gouhier, Auroop R. Ganguly, Udit Bhatia
Communications Earth and Environment, 2025
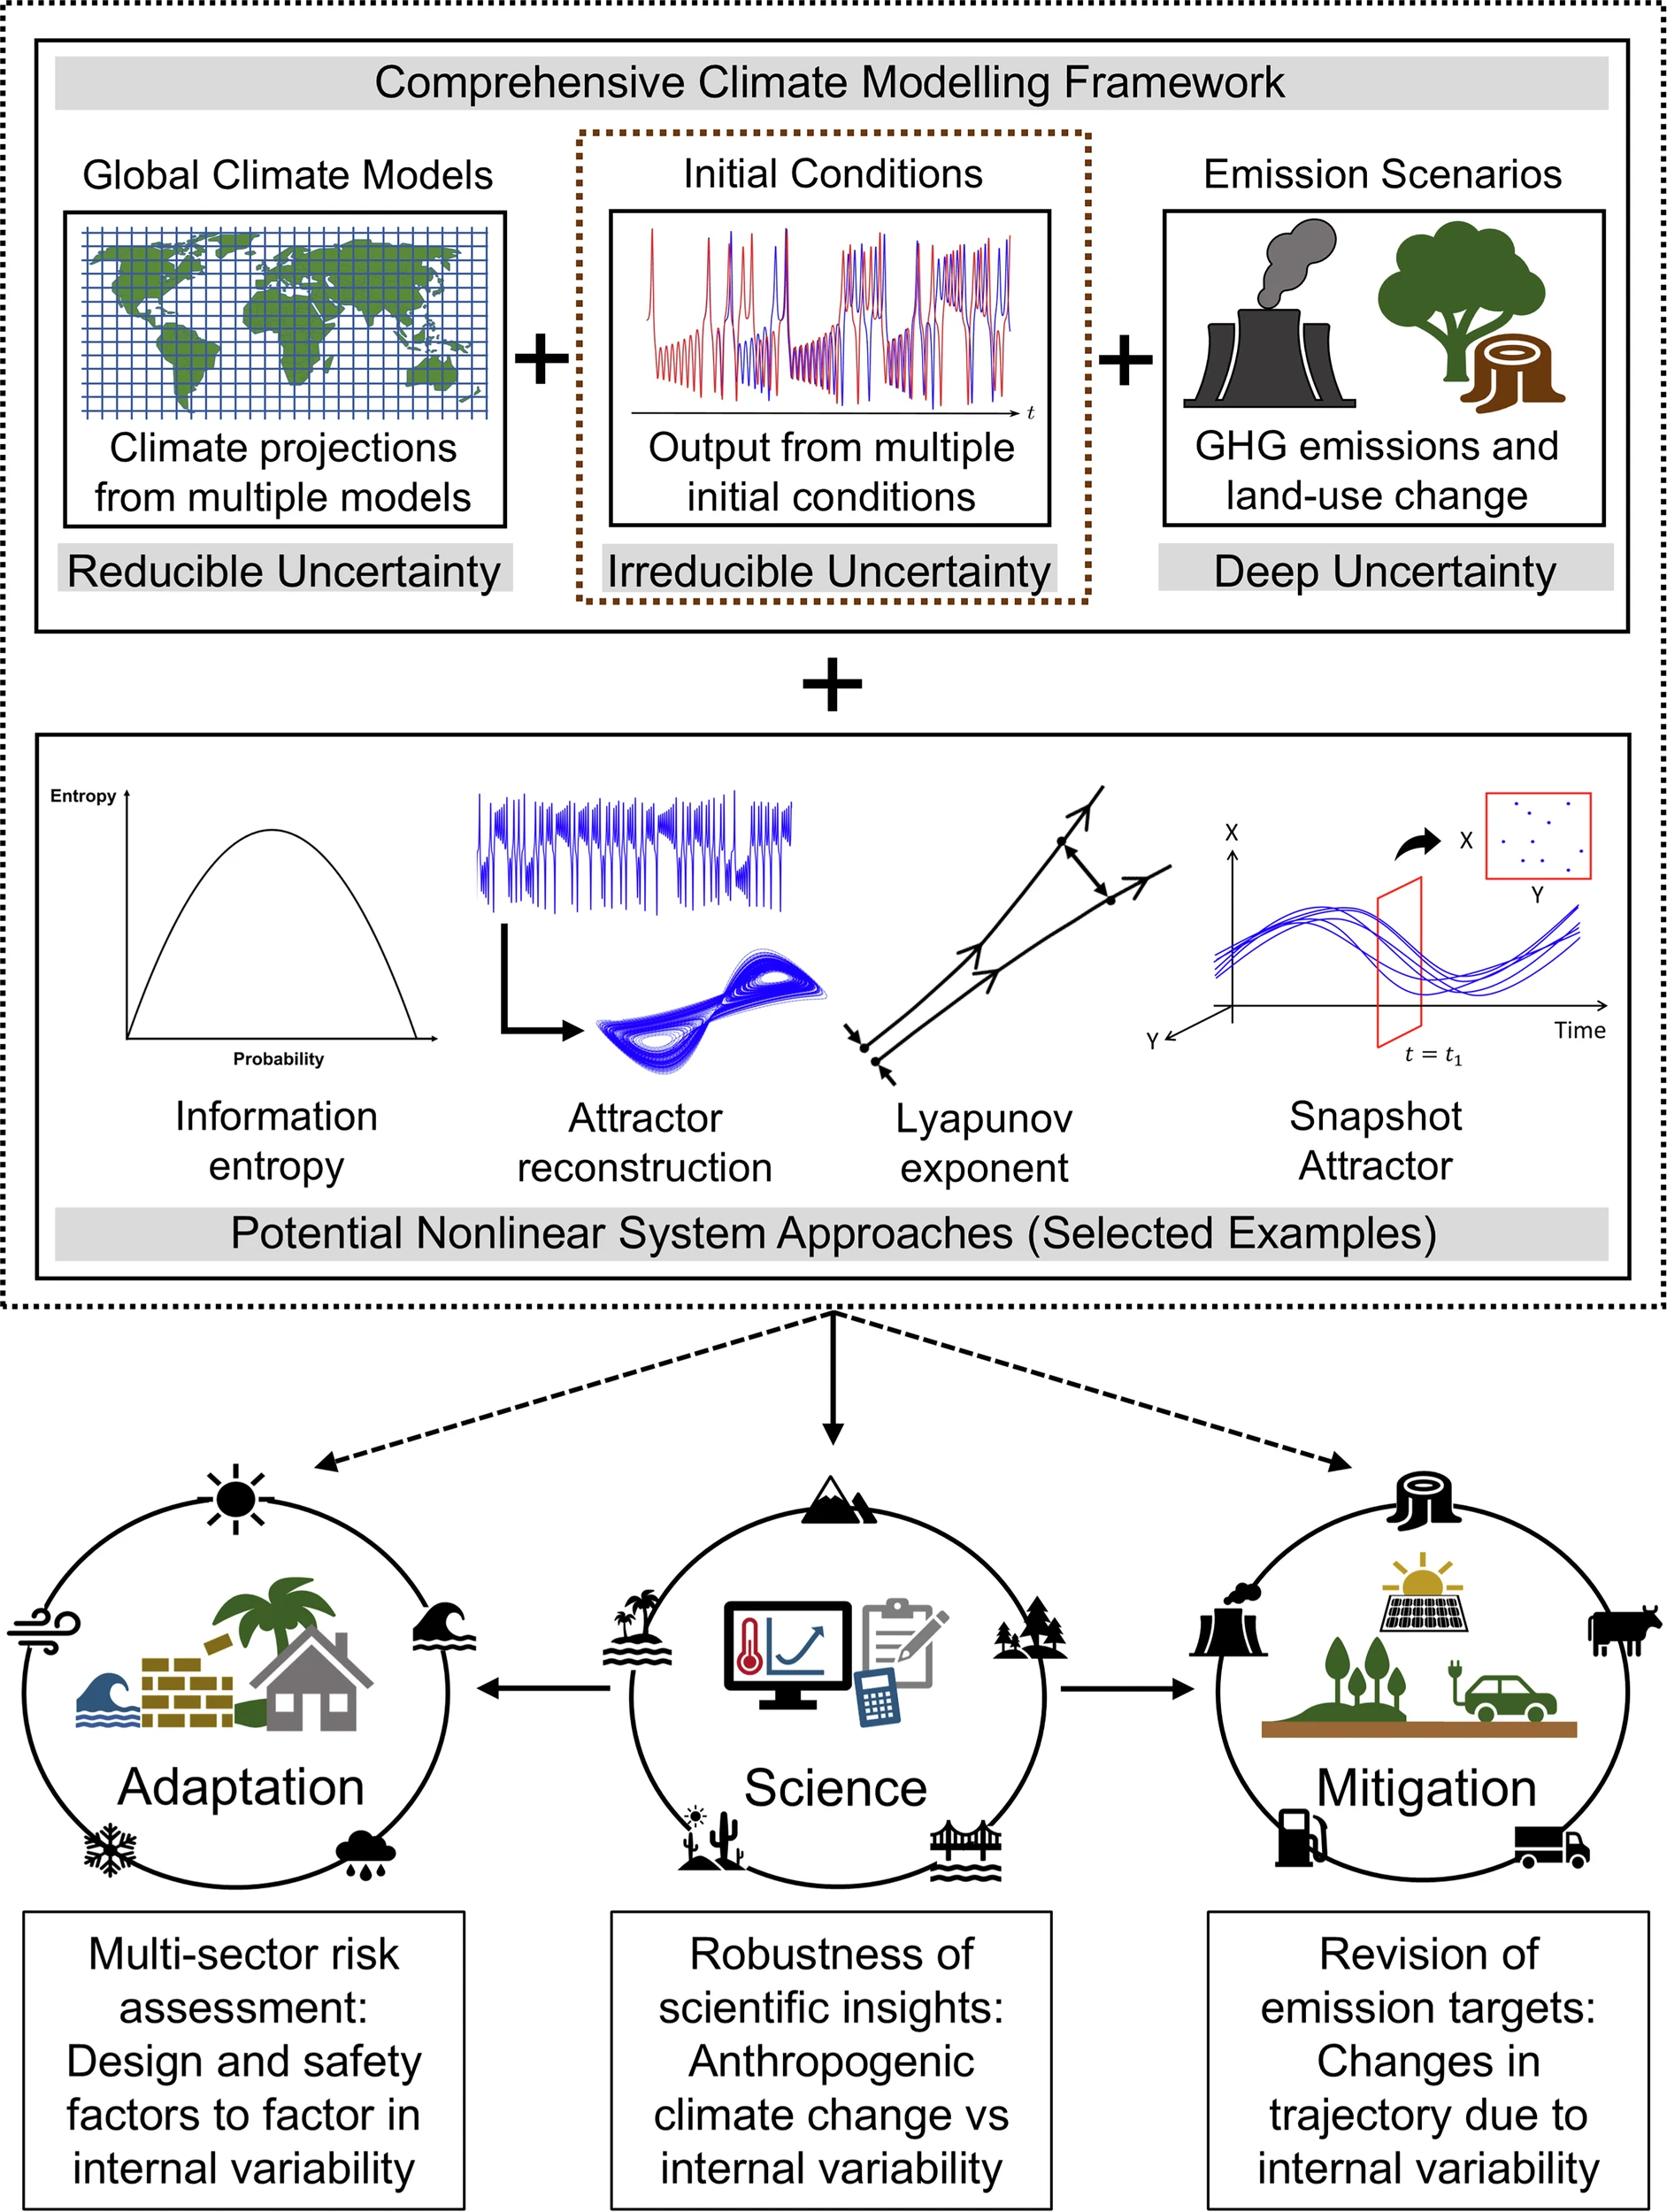
Internal climate variability (ICV) remains a major source of uncertainty in climate projections, complicating impact assessments across critical sectors, especially at stakeholder-relevant scales. Given that ICV emerges from the nonlinear interactions of the climate system, we argue that nonlinear dynamical (NLD) approaches can improve its characterization, providing physically interpretable insights that strengthen adaptation strategies and support multisector decision-making. However, despite their suitability for such problems, NLD approaches remain largely underutilized in the analysis of initial condition large ensembles (LEs). We argue that a diverse suite of NLD approaches offers a promising pathway for systematically extracting robust insights from LEs. If effectively applied and systematically integrated, these methods could fully harness the potential of LEs, uncovering underlying patterns and variability across ensemble members to refine fundamental insights from climate projections. This will help bridge the gap between complex climate dynamics and practical resilience strategies, ensuring that decision-makers, resource managers, and infrastructure planners have a more reliable foundation for navigating irreducible uncertainty.
Rachindra Mawalagedara, Arnob Ray, Puja Das, Jack Watson, Ashis Kumar Pal, Kate Duffy, Udit Bhatia, Daniel P. Aldrich, Auroop R. Ganguly
npj Climate and Atmospheric Science, 2025
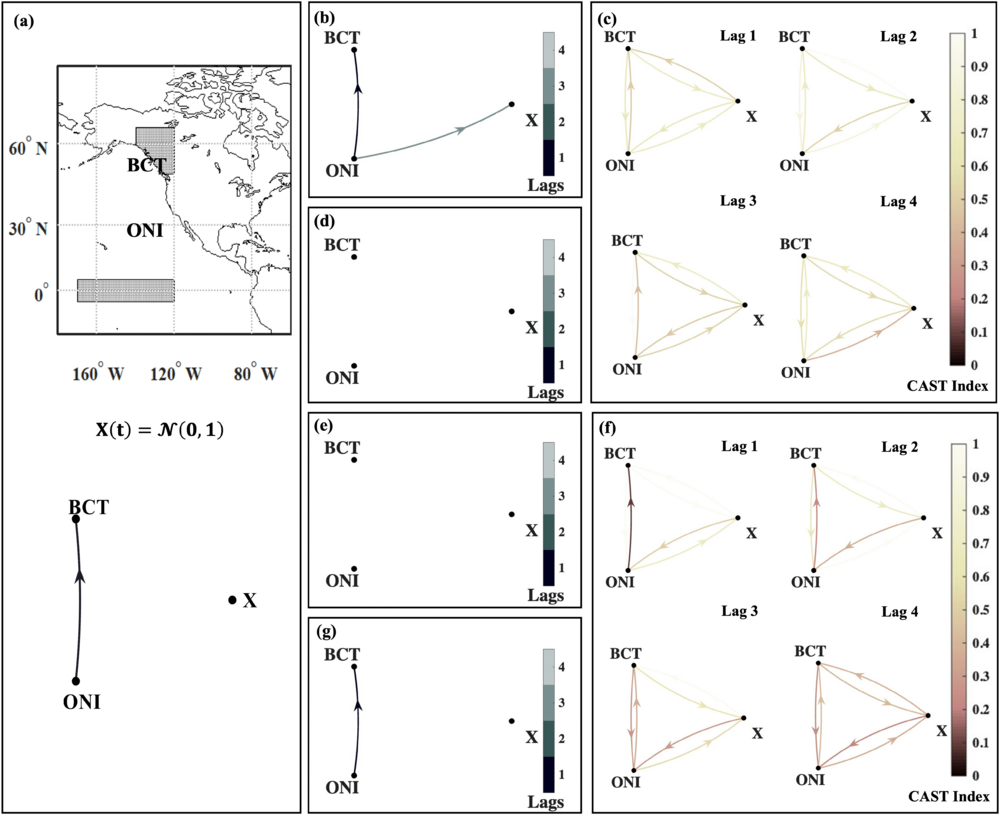
Causal and attribution studies are essential for earth scientific discoveries and critical for informing climate, ecology, and water policies. However, the current generation of methods needs to keep pace with the complexity of scientific, data availability, and stakeholder challenges, combined with the adequacy of data-driven methods. Unless carefully informed by physics, they run the risk of conflating correlation with causation or getting overwhelmed by estimation inaccuracies. In particular, information-theoretic approaches such as transfer entropy (TE), despite their recent popularity and widespread use, can yield spurious causal links, even when statistical significance testing is applied. To address this, we introduce CAST (Causal Analysis Spuriousness Test), a subsample-based ensemble framework that quantifies the robustness of inferred links via the CAST index. Through extensive simulations across systems with varying dynamics as well as applications to real-world climate datasets, we demonstrate that CAST effectively filters unreliable connections while preserving true causal relationships. Our findings underscore the need for consistency-based evaluation in causal discovery and provide a generalizable strategy to enhance the reliability of TE-based and other data-driven causal methods in Earth sciences.
Elizabeth Eldhose, Auroop R. Ganguly, Snigdhansu Chatterjee, Tejasvi Chauhan, Vikram Chandel6, Subimal Ghosh
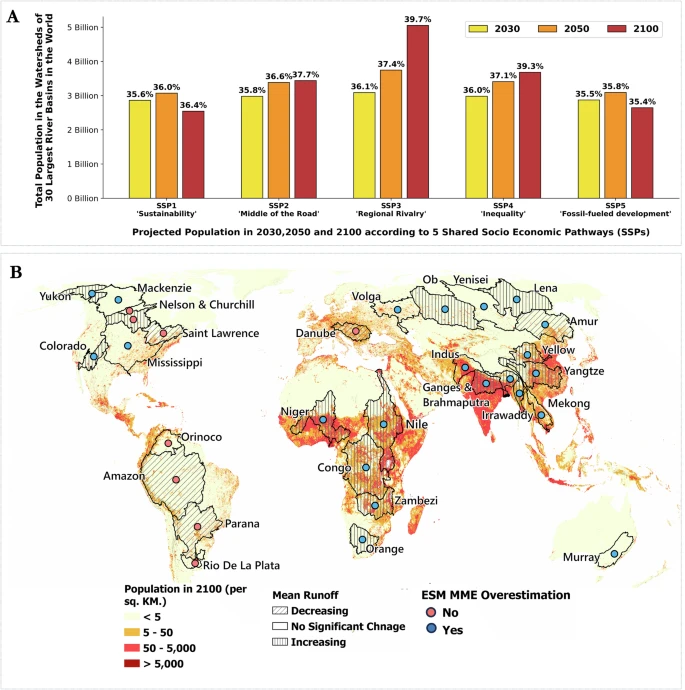
Earth system models inform water policy and interventions, but knowledge gaps in hydrologic representations limit the credibility of projections and impacts assessments. The literature does not provide conclusive evidence that incorporating higher resolutions, comprehensive process models, and latest parameterization schemes, will result in improvements. We compare hydroclimate representations and runoff projections across two generations of Coupled Modeling Intercomparison Project (CMIP) models, specifically, CMIP5 and CMIP6, with gridded runoff from Global Runoff Reconstruction (GRUN) and ECMWF Reanalysis V5 (ERA5) as benchmarks. Our results show that systematic embedding of the best available process models and parameterizations, together with finer resolutions, improve runoff projections with uncertainty characterizations in 30 of the largest rivers worldwide in a mechanistically explainable manner. The more skillful CMIP6 models suggest that, following the mid-range SSP370 emissions scenario, 40% of the rivers will exhibit decreased runoff by 2100, impacting 850 million people.
Puja Das, Auroop R. Ganguly
npj Climate and Atmospheric Science, 2024
Resilient operation of interdependent infrastructures against compound hazard events is essential for maintaining societal well-being. To address consequence assessment challenges in this problem space, we propose a novel tri-level optimization model applied to a proof-of-concept case study with fuel distribution and transportation networks – encompassing one realistic network; one fictitious, yet realistic network; as well as networks drawn from three synthetic distributions. Mathematically, our approach takes the form of a defender-attacker-defender (DAD) model—a multi-agent tri-level optimization, comprised of a defender, attacker, and an operator acting in sequence. Here, our notional operator may choose proxy actions to operate an interdependent system comprised of fuel terminals and gas stations (functioning as supplies) and a transportation network with traffic flow (functioning as demand) to minimize unmet demand at gas stations. A notional attacker aims to hypothetically disrupt normal operations by reducing supply at the supply terminals, and the notional defender aims to identify best proxy defense policy options which include hardening supply terminals or allowing alternative distribution methods such as trucking reserve supplies. We solve our DAD formulation at a metropolitan scale and present practical defense policy insights against hypothetical compound hazards. We demonstrate the generalizability of our framework by presenting results for a realistic network; a fictitious, yet realistic network; as well as for three networks drawn from synthetic distributions. We also analyze the sensitivity of outputs on budget constraints through a detailed case study. Additionally, we demonstrate the scalability of the framework by investigating runtime performance as a function of the network size. Steps for future research are also discussed.
Matthew R. Oster, Ilya Amburg, Samrat Chatterjee, Daniel A. Eisenberg, Dennis G. Thomas, Feng Pan, Auroop R. Ganguly
International Journal of Critical Infrastructure Protection, 2024
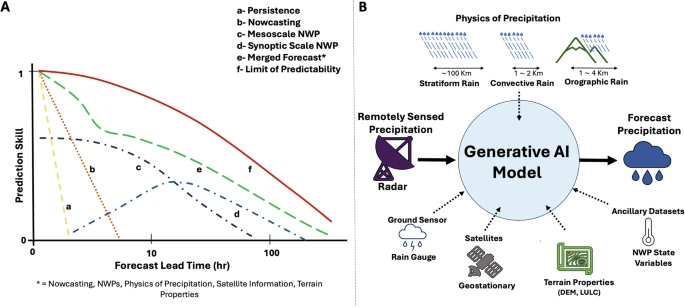
Precipitation nowcasting, which is critical for flood emergency and river management, has remained challenging for decades, although recent developments in deep generative modeling (DGM) suggest the possibility of improvements. River management centers, such as the Tennessee Valley Authority, have been using Numerical Weather Prediction (NWP) models for nowcasting, but they have been struggling with missed detections even from best-in-class NWP models. While decades of prior research achieved limited improvements beyond advection and localized evolution, recent attempts have shown progress from so-called physics-free machine learning (ML) methods, and even greater improvements from physics-embedded ML approaches. Developers of DGM for nowcasting have compared their approaches with optical flow (a variant of advection) and meteorologists’ judgment, but not with NWP models. Further, they have not conducted independent co-evaluations with water resources and river managers. Here we show that the state-of-the-art physics-embedded deep generative model, specifically NowcastNet, outperforms the High Resolution Rapid Refresh (HRRR) model, which is the latest generation of NWP, along with advection and persistence, especially for heavy precipitation events. Thus, for grid-cell extremes over 16 mm/h, NowcastNet demonstrated a median critical success index (CSI) of 0.30, compared with median CSI of 0.04 for HRRR. However, despite hydrologically-relevant improvements in point-by-point forecasts from NowcastNet, caveats include overestimation of spatially aggregate precipitation over longer lead times. Our co-evaluation with ML developers, hydrologists and river managers suggest the possibility of improved flood emergency response and hydropower management.
Puja Das, August Posch, Nathan Barber, Michael Hicks, Kate Duffy, Thomas Vandal, Debjani Singh, Katie van Werkhoven, Auroop R. Ganguly
npj Climate and Atmospheric Science, 2024
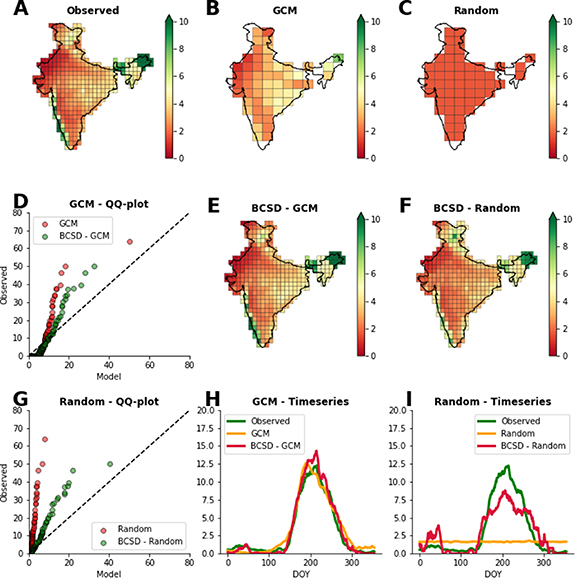
Quantile mapping based bias correction and spatial disaggregation (BCSD) have emerged as the de facto standard for rectifying bias and scale-mismatch in global climate models (GCMs) leading to novel climate science insights and new information for impacts and adaptation. Focusing on critical variables crucial for understanding climate dynamics in India and the United States, our evaluation challenges the premise of BCSD approach. We find that BCSD overcorrects GCM simulations to observed patterns while minimizing or even nullifying science-informed projections generated by GCMs. Furthermore, we show that BCSD incorrectly captures extremes and complex climate signals. Our evaluation in the context of the Walker circulation suggests that this inability to adequately capture multivariate and spatial-temporal dependence patterns may at least partially explain the challenges with BCSD.
Vikram Singh Chandel, Udit Bhatia, Auroop R Ganguly, Subimal Ghosh
Environmental Research Letters, 2024
![]()
Networked dynamics are essential for assessing the resilience of lifeline infrastructures. The dimension-reduction approach was designed as an efficient way to map the high-dimensional dynamics to a low-dimensional representation capturing system-level behavior while taking into consideration network structure. However, its application to socio-technical systems has not been considered yet. Here, we extend the dimension-reduction approach to resource-flow dynamics in multiplex networks. We apply it to the San Francisco fuel transportation network, considering the flow between refineries, terminals and gas stations. We capture the aggregated dynamics between the facilities of each type and identify macroscopic conditions for the system to supply a given demand of fuel. By considering multiple sea level rise scenarios between 2020 and 2100, we address the impact of coastal flooding due to climate change on the maximum suppliable demand. Finally, we analyze the system’s transient response to production failures, investigating the temporary interruption in production and the duration it takes for complete demand satisfaction to become unachievable after the interruption.
Ariel Salgado, Yiyi He, John Radke, Auroop Ratan Ganguly, Marta C. Gonzalez
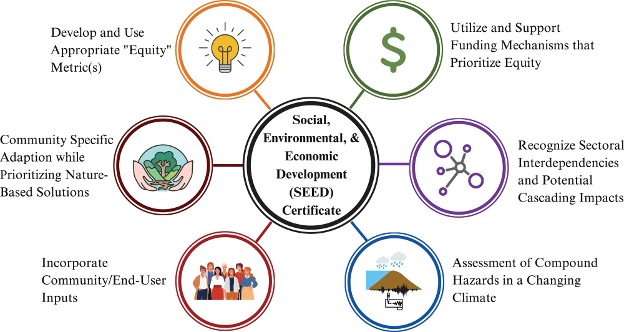
Recent major investments in infrastructure in the United States and globally present a crucial opportunity to embed equity within the heart of resilient infrastructure decision-making. Yet there is a notable absence of frameworks within the engineering and scientific fields for integrating equity into planning, design, and maintenance of infrastructure. Additionally, whole-of-government approaches to infrastructure, including the Justice40 Initiative, mimic elements of process management that support exploitative rather than exploratory innovation. These and other policies risk creating innovation traps that limit analytical and engineering advances necessary to prioritize equity in decision-making, identification and disruption of mechanisms that cause or contribute to inequities, and remediation of historic harms. Here, we propose a three-tiered framework toward equitable and resilient infrastructure through restorative justice, incremental policy innovation, and exploratory research innovation. This framework aims to ensure equitable access and benefits of infrastructure, minimize risk disparities, and embrace restorative justice to repair historical and systemic inequities. We outline incremental policy innovation and exploratory research action items to address and mitigate risk disparities, emphasizing the need for community-engaged research and the development of equity metrics. Among other action items, we recommend a certification system—referred to as Social, Environmental, and Economic Development (SEED)—to train infrastructure engineers and planners and ensure attentiveness to gaps that exist within and dynamically interact across each tier of the proposed framework. Through the framework and proposed actions, we advocate for a transformative vision for equitable infrastructure that emphasizes the interconnectedness of social, environmental, and technical dimensions in infrastructure planning, design, and maintenance.
Jason P Giovannettone , Gregg P Macey , Amir AghaKouchak , Michele Barbato , William J Capehart , Auroop R Ganguly , Mital Hall , Jennifer F Helgeson , Si Han Li , Teng Wu , Guirong Yan , Farshid Vahedifard
![]()
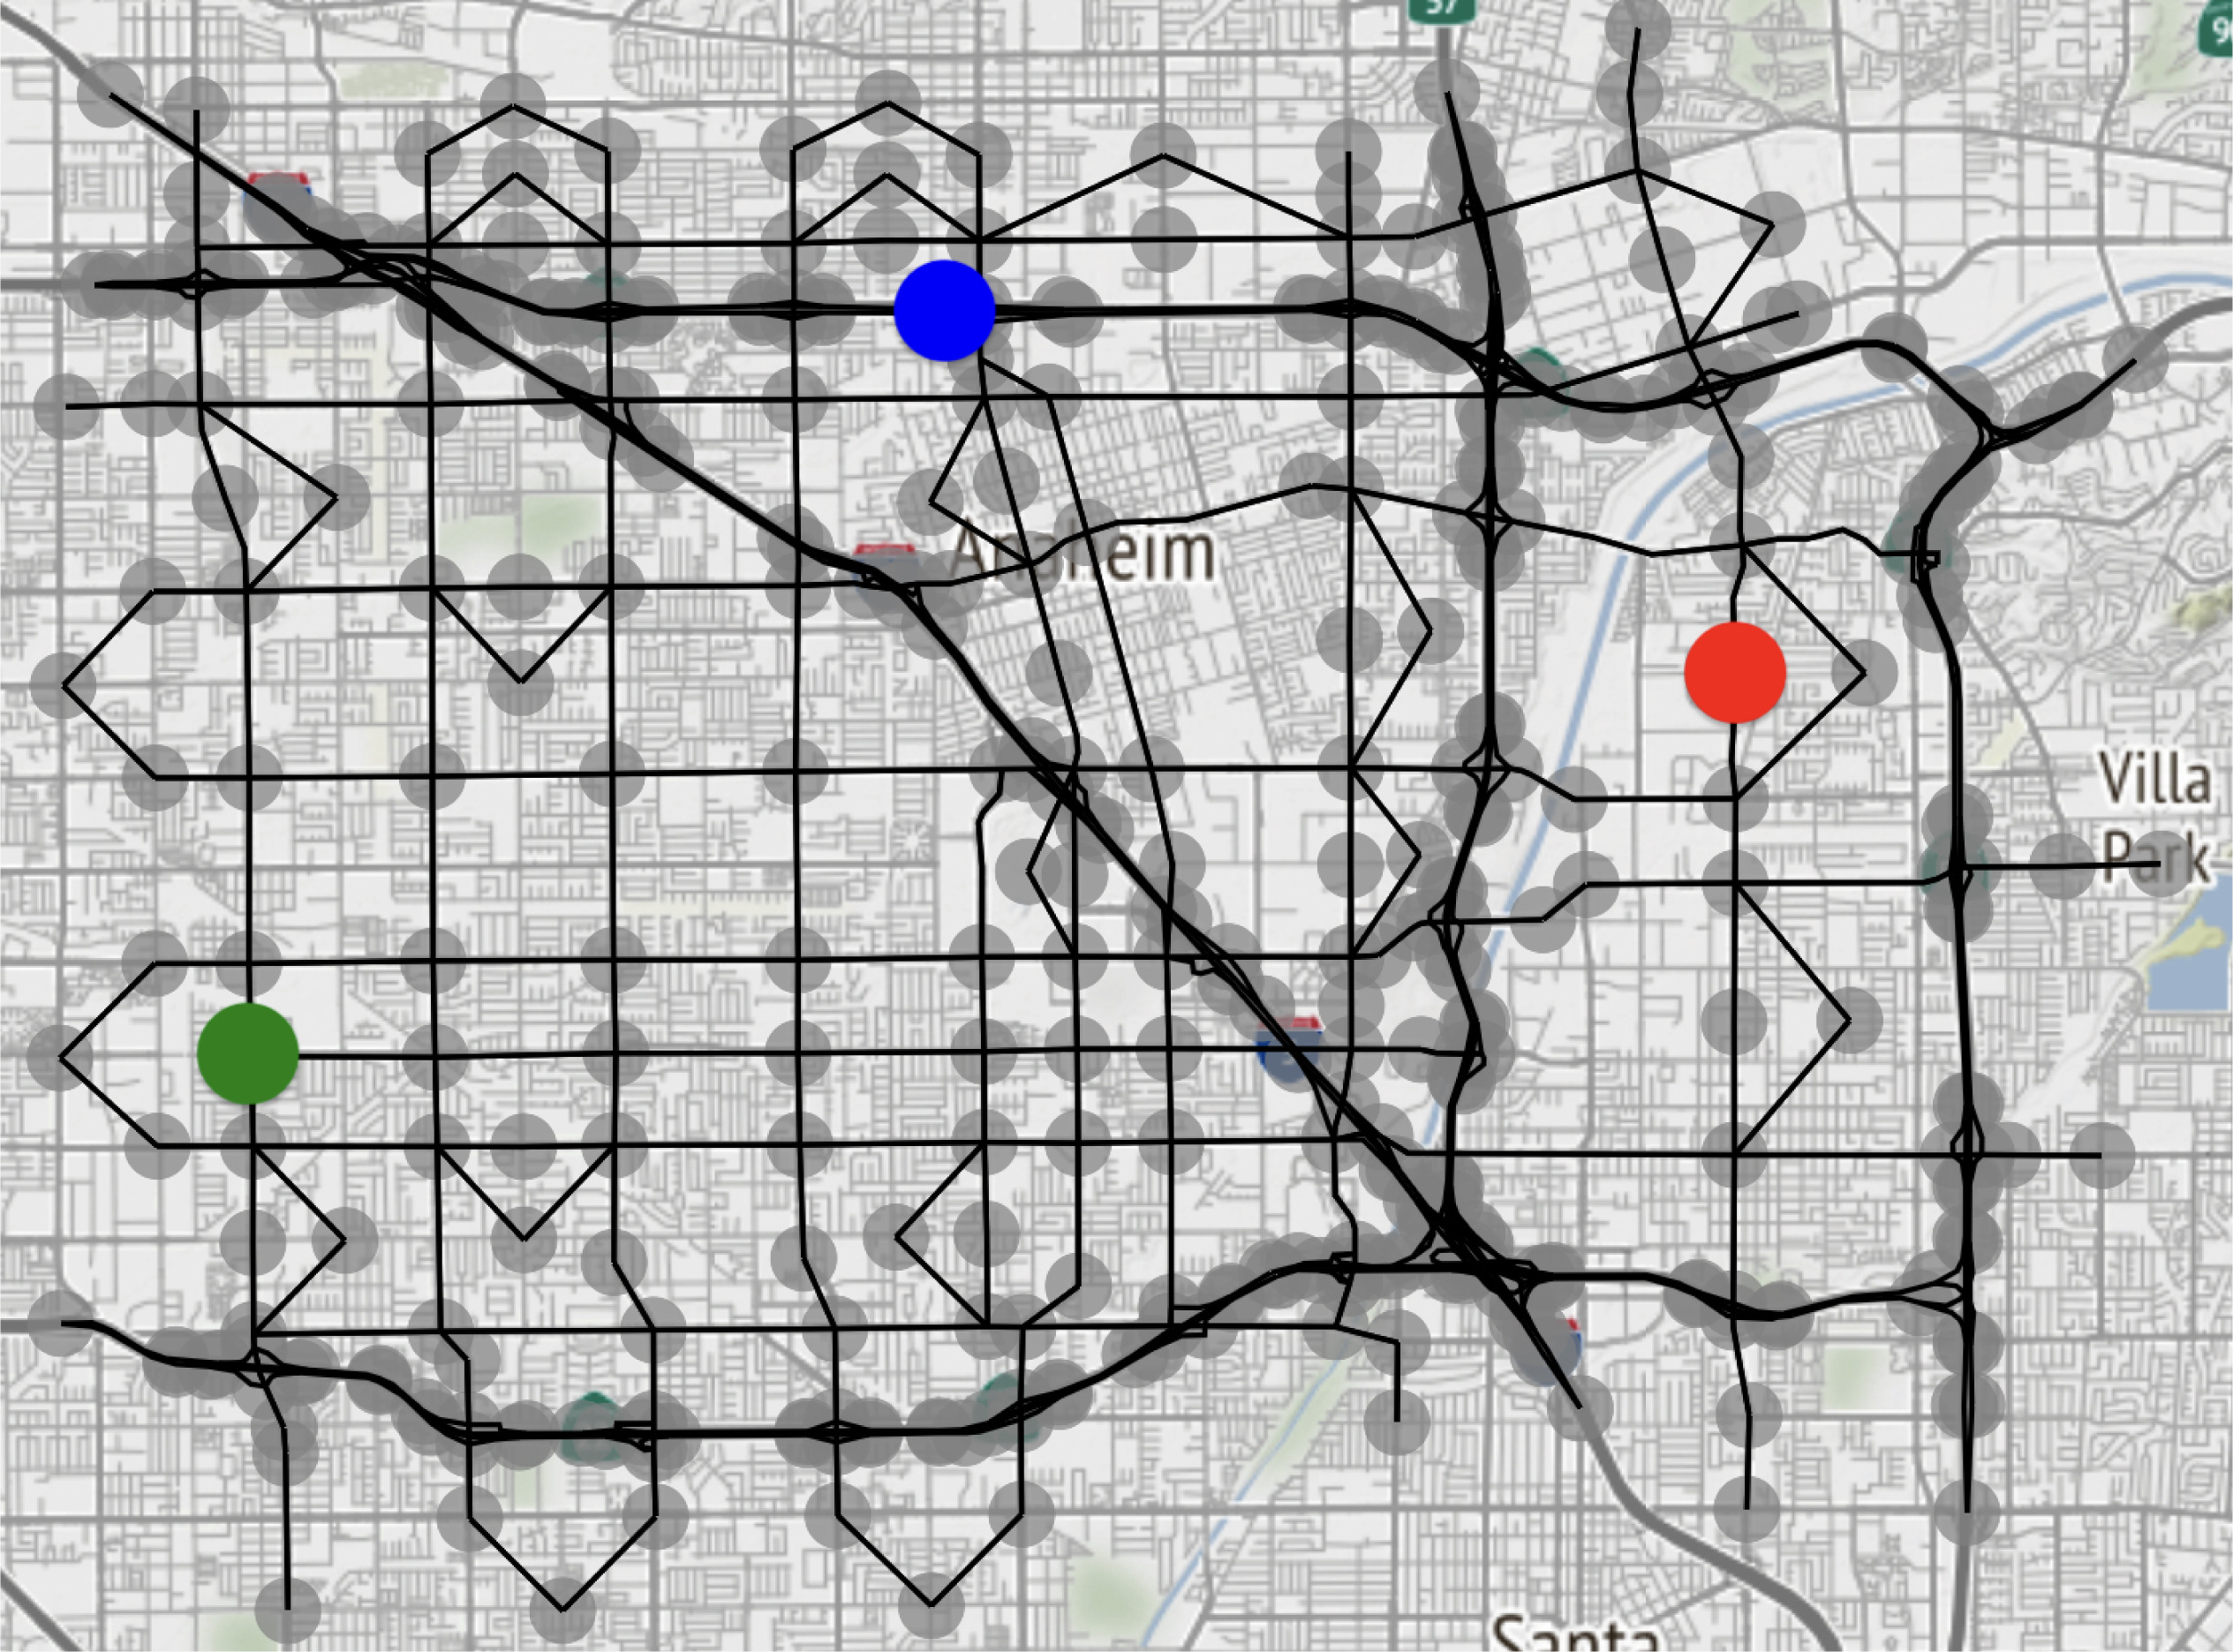
Urban air pollution is a critical public health challenge in low-and-middle-income countries (LMICs). At the same time, LMICs tend to be data-poor, lacking adequate infrastructure to monitor air quality (AQ). As LMICs undergo rapid urbanization, the socio-economic burden of poor AQ will be immense. Here we present a globally scalable two-step deep learning (DL) based approach for AQ estimation in LMIC cities that mitigates the need for extensive AQ infrastructure on the ground. We train a DL model that can map satellite imagery to AQ in high-income countries (HICs) with sufficient ground data, and then adapt the model to learn meaningful AQ estimates in LMIC cities using transfer learning. The trained model can explain up to 54% of the variation in the AQ distribution of the target LMIC city without the need for target labels. The approach is demonstrated for Accra in Ghana, Africa, with AQ patterns learned and adapted from two HIC cities, specifically Los Angeles and New York.
Nishant Yadav, Meytar Sorek-Hamer, Michael Von Pohle, Ata Akbari Asanjan, Adwait Sahasrabhojanee, Esra Suel, Raphael E Arku, Violet Lingenfelter, Michael Brauer, Majid Ezzati, Nikunj Oza, Auroop R. Ganguly

Redressing global patterns of biodiversity loss requires quantitative frameworks that can predict ecosystem collapse and inform restoration strategies. By applying a network-based dynamical approach to synthetic and real-world mutualistic ecosystems, we show that biodiversity recovery following collapse is maximized when extirpated species are reintroduced based solely on their total number of connections in the original interaction network. More complex network-based strategies that prioritize the reintroduction of species that improve ‘higher order’ topological features such as compartmentalization do not provide meaningful performance improvements. These results suggest that it is possible to design nearly optimal restoration strategies that maximize biodiversity recovery for data-poor ecosystems in order to ensure the delivery of critical natural services that fuel economic development, food security, and human health around the globe.
Udit Bhatia, Sarth Dubey, Tarik C. Gouhier & Auroop R. Ganguly
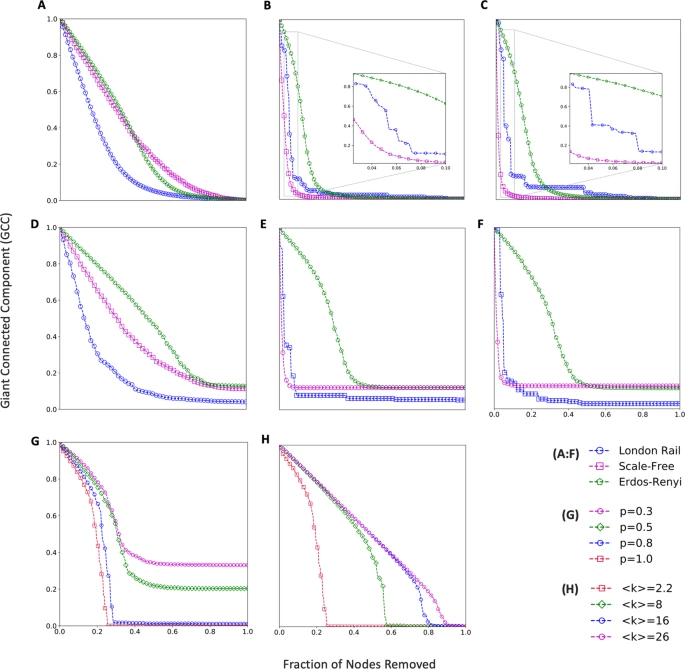
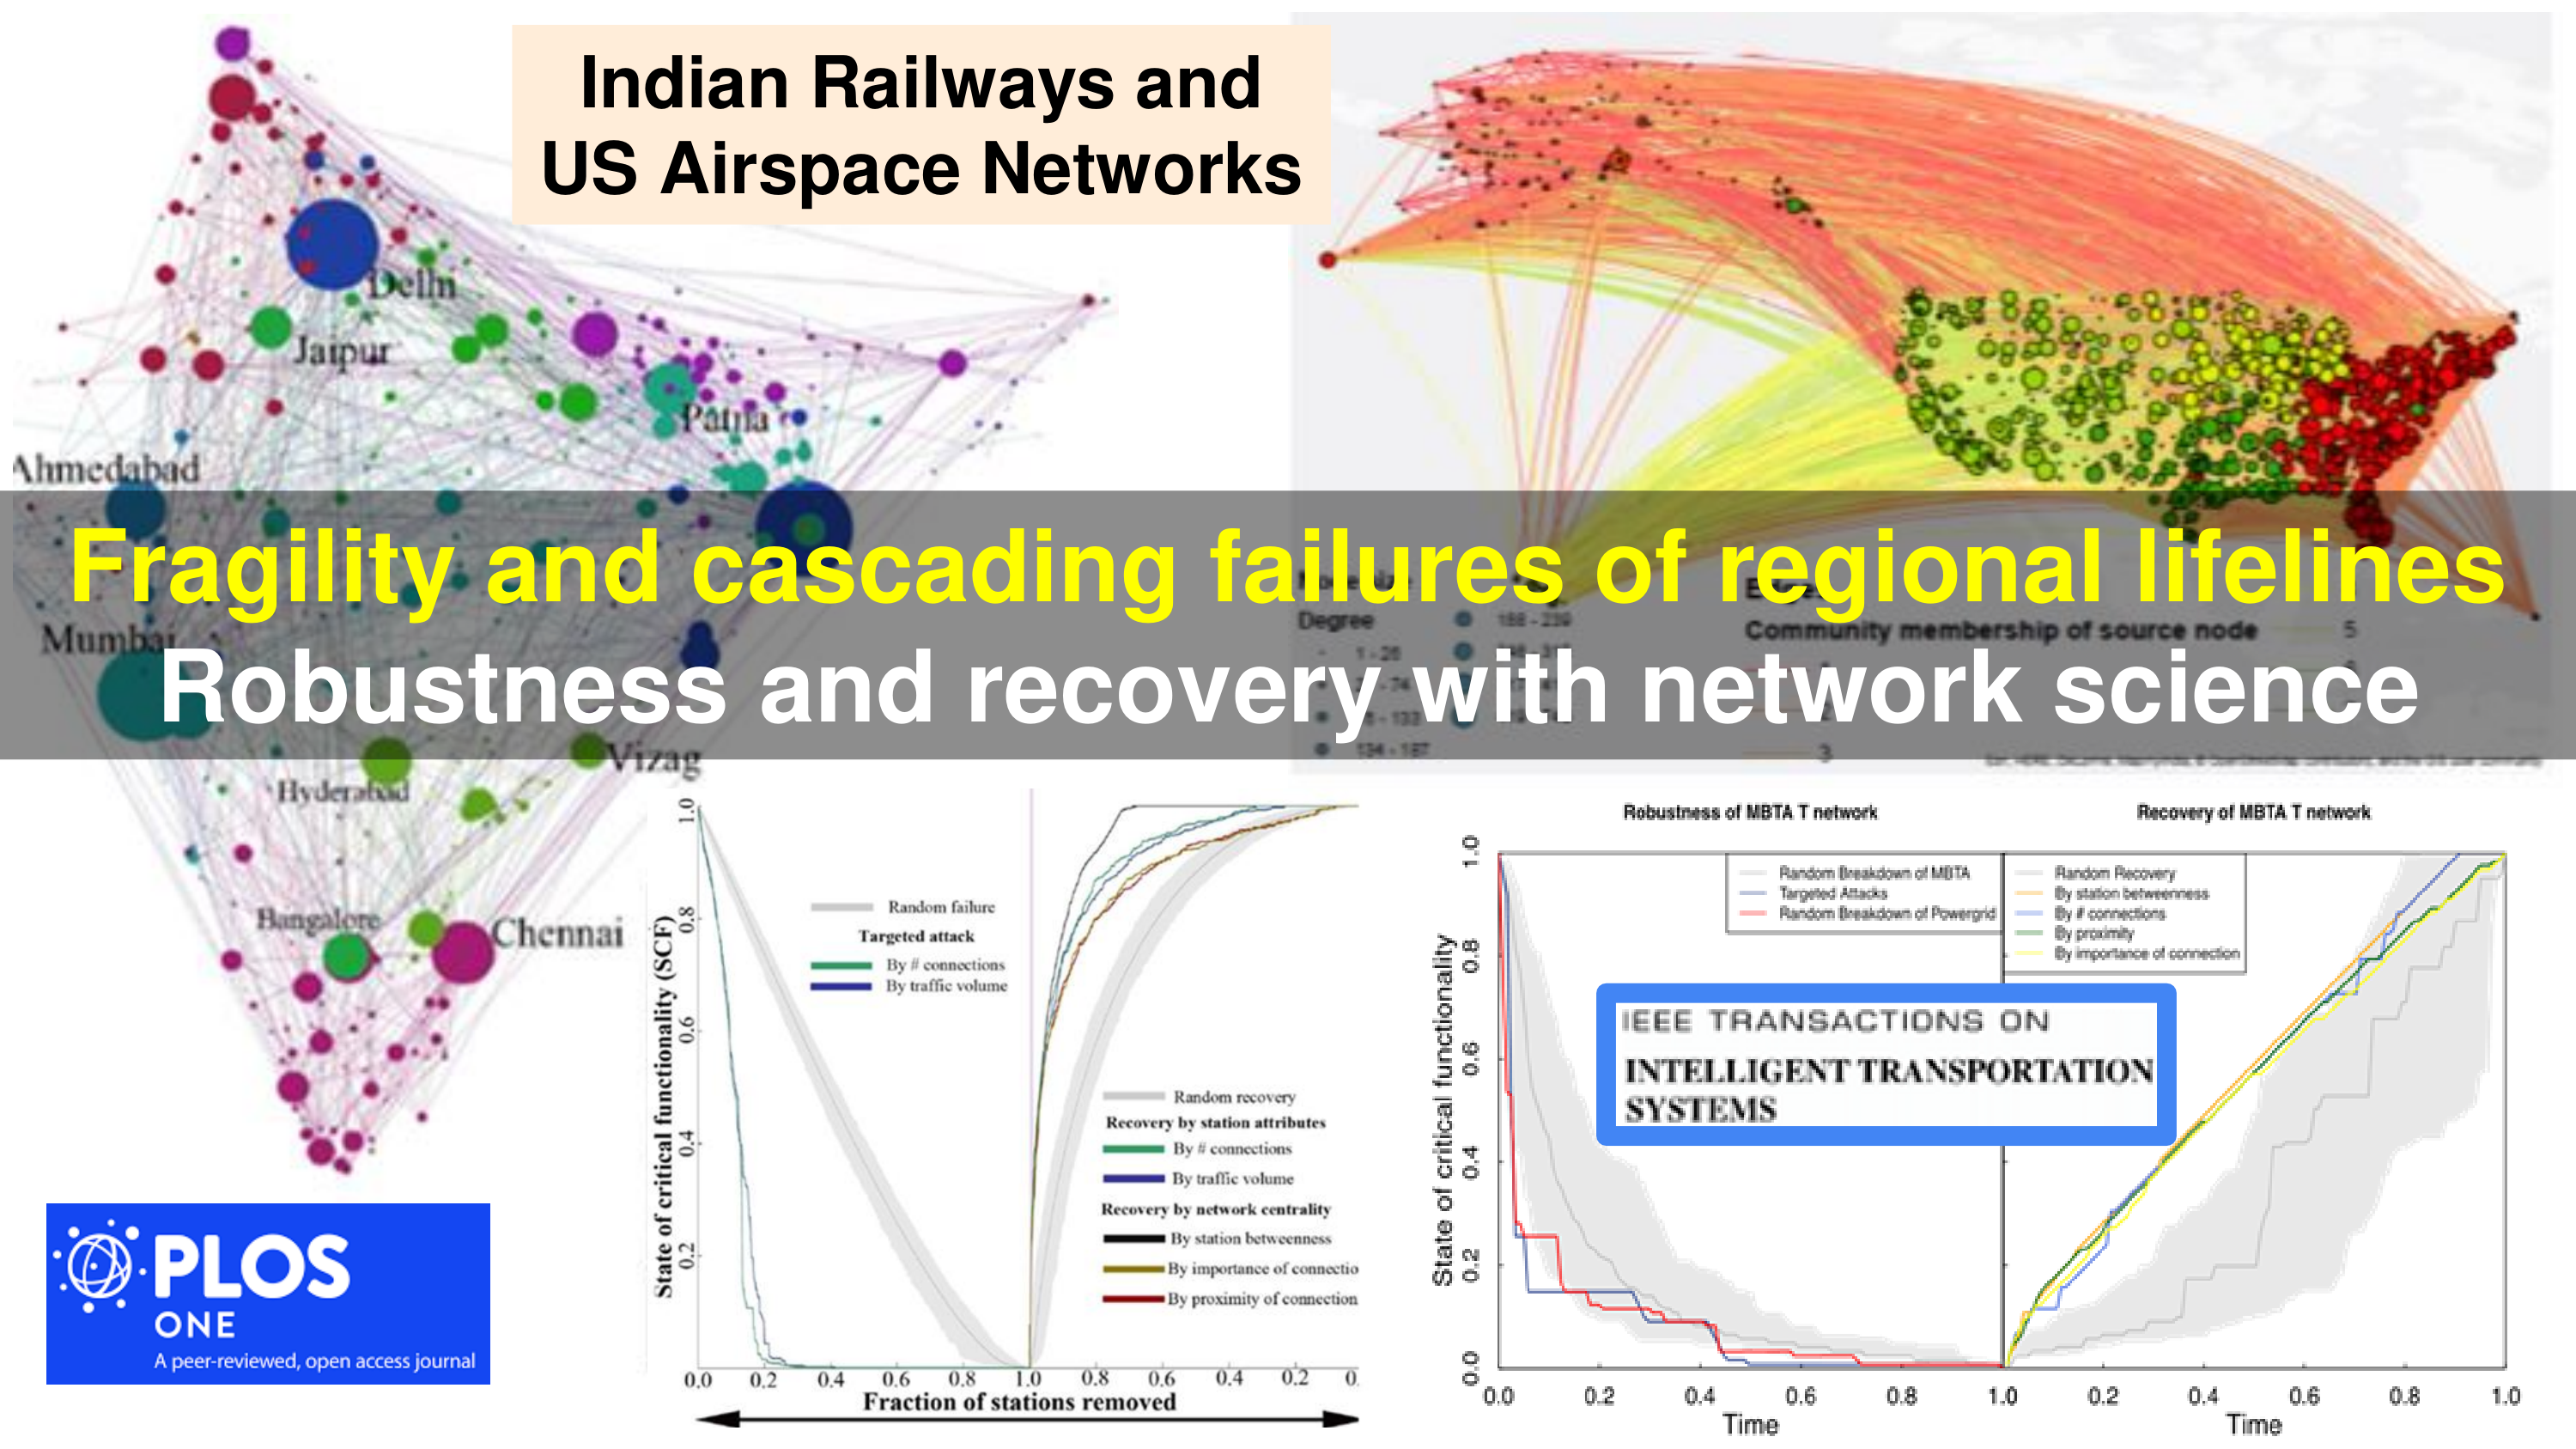
Natural hazards including floods can trigger catastrophic failures in interdependent urban transport network-of-networks (NoNs). Population growth has enhanced transportation demand while urbanization and climate change have intensified urban floods. However, despite the clear need to develop actionable insights for improving the resilience of critical urban lifelines, the theory and methods remain underdeveloped. Furthermore, as infrastructure systems become more intelligent, security experts point to the growing threat of targeted cyber-physical attacks during natural hazards. Here we develop a hypothesis-driven resilience framework for urban transport NoNs, which we demonstrate on the London Rail Network (LRN). We find that topological attributes designed for maximizing efficiency rather than robustness render the network more vulnerable to compound natural-targeted disruptions including cascading failures. Our results suggest that an organizing principle for post-disruption recovery may be developed with network science principles. Our findings and frameworks can generalize to urban lifelines and more generally to real-world spatial networks.
Nishant Yadav, Samrat Chatterjee , Auroop R. Ganguly
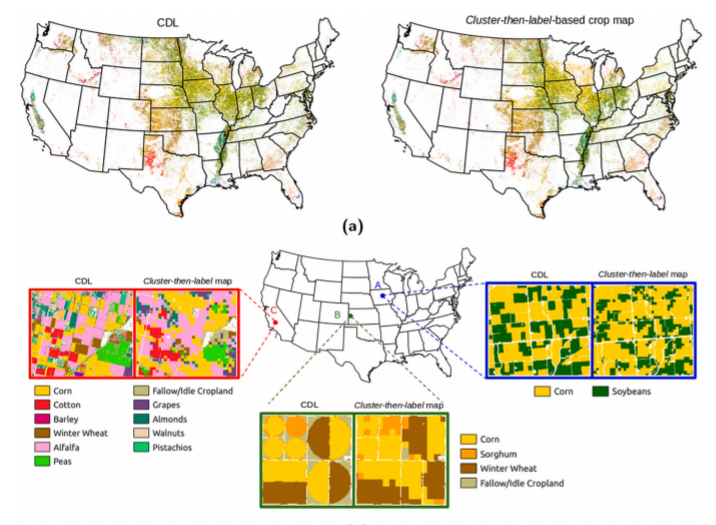
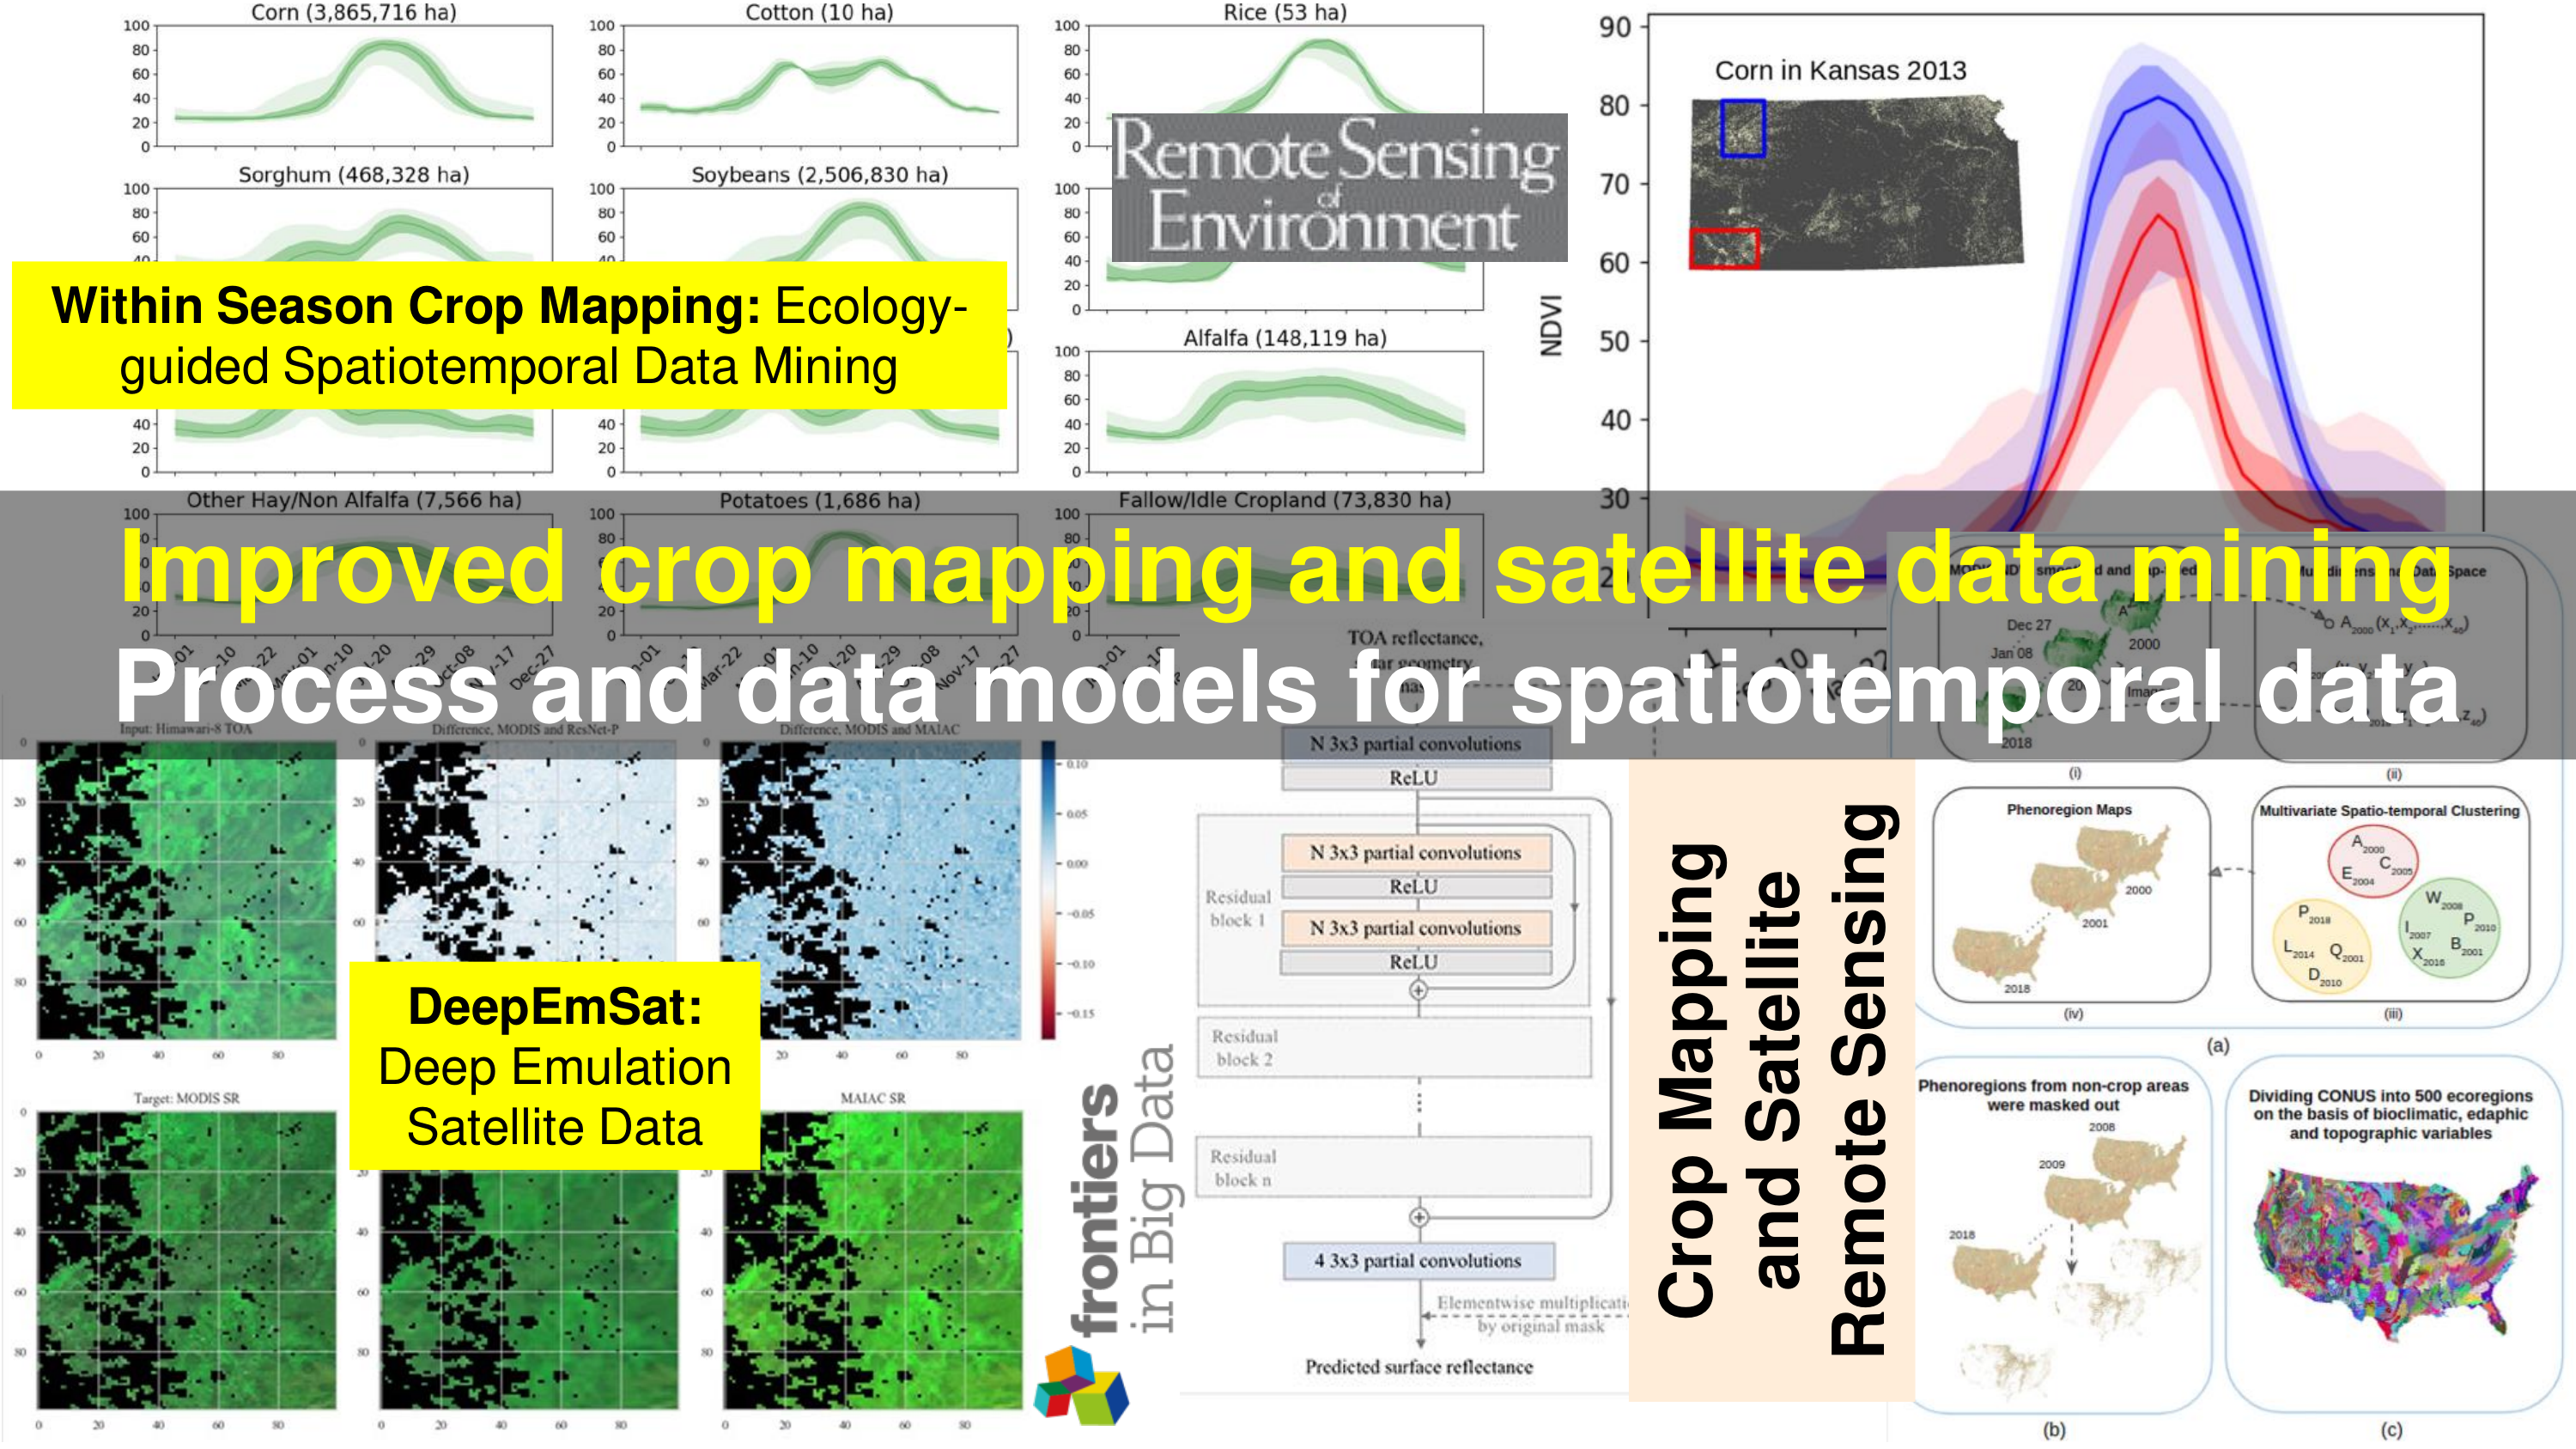
Timely and accurate knowledge about the geospatial distribution of crops at regional to continental scales is crucial for forecasting crop production and estimating crop water use. The United States (US) is one of the leading food-producing countries, but lacks a nationwide high resolution crop-specific land cover map available publicly during the current growing season. The goal of this study was to map crops across the Continental US (CONUS) before the harvest, and to estimate the earliest date of classification by which crops can be mapped with sufficient accuracy (90% of full-season accuracy). The study employed a scalable cluster-then-label model that was trained on multiple years of MODIS NDVI using ground truth data in the form of US Department of Agriculture (USDA) Cropland Data Layer (CDL) products. The first step in the crop classification was to perform Multivariate Spatio-Temporal Clustering (MSTC) of annual MODIS-derived NDVI trajectories to create phenologically similar regions, or phenoregions. The second step was to assign crop labels to phenoregions based on spatial concordance between phenoregions and crop classes from CDL using Mapcurves. Assigning crop labels to phenoregions was performed within ecoregions to reduce classification errors due to spatial variability in phenology caused by variations in climate, agricultural practices, and growing conditions. The crop classifier was trained and validated on the years 2008–2014, then tested independently on 2015–2018. Ecoregion-level crop classification performed better than state-level and CONUS-level classification. Pixel-wise accuracy of classification for eight major crops by area was around 70% across the major corn-, soybeans- and winter wheatproducing areas, whereas regions characterized by high crop diversity had slightly lower accuracy. Classification accuracy for dominant crops like corn, soybeans, winter wheat, fallow/idle cropland and other hay/non alfalfa improved with time as they grew, reaching 90% of year-end accuracy by the end of August over each of the four unseen years in the test period. For corn and soybeans, the earliest dates of classification were found to be much earlier in the central regions of the Corn Belt (parts of Iowa, Illinois and Indiana) than in peripheral areas. The ability to map growing crops may permit near real-time monitoring of the health status and vigor of agricultural crops nationally.
Venkata Shashank Konduri,Jitendra Kumar, William W. Hargrove, Forrest M. Hoffman, Auroop R.Ganguly
Remote Sensing of Environment, 2020
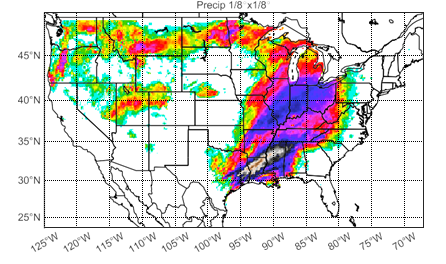
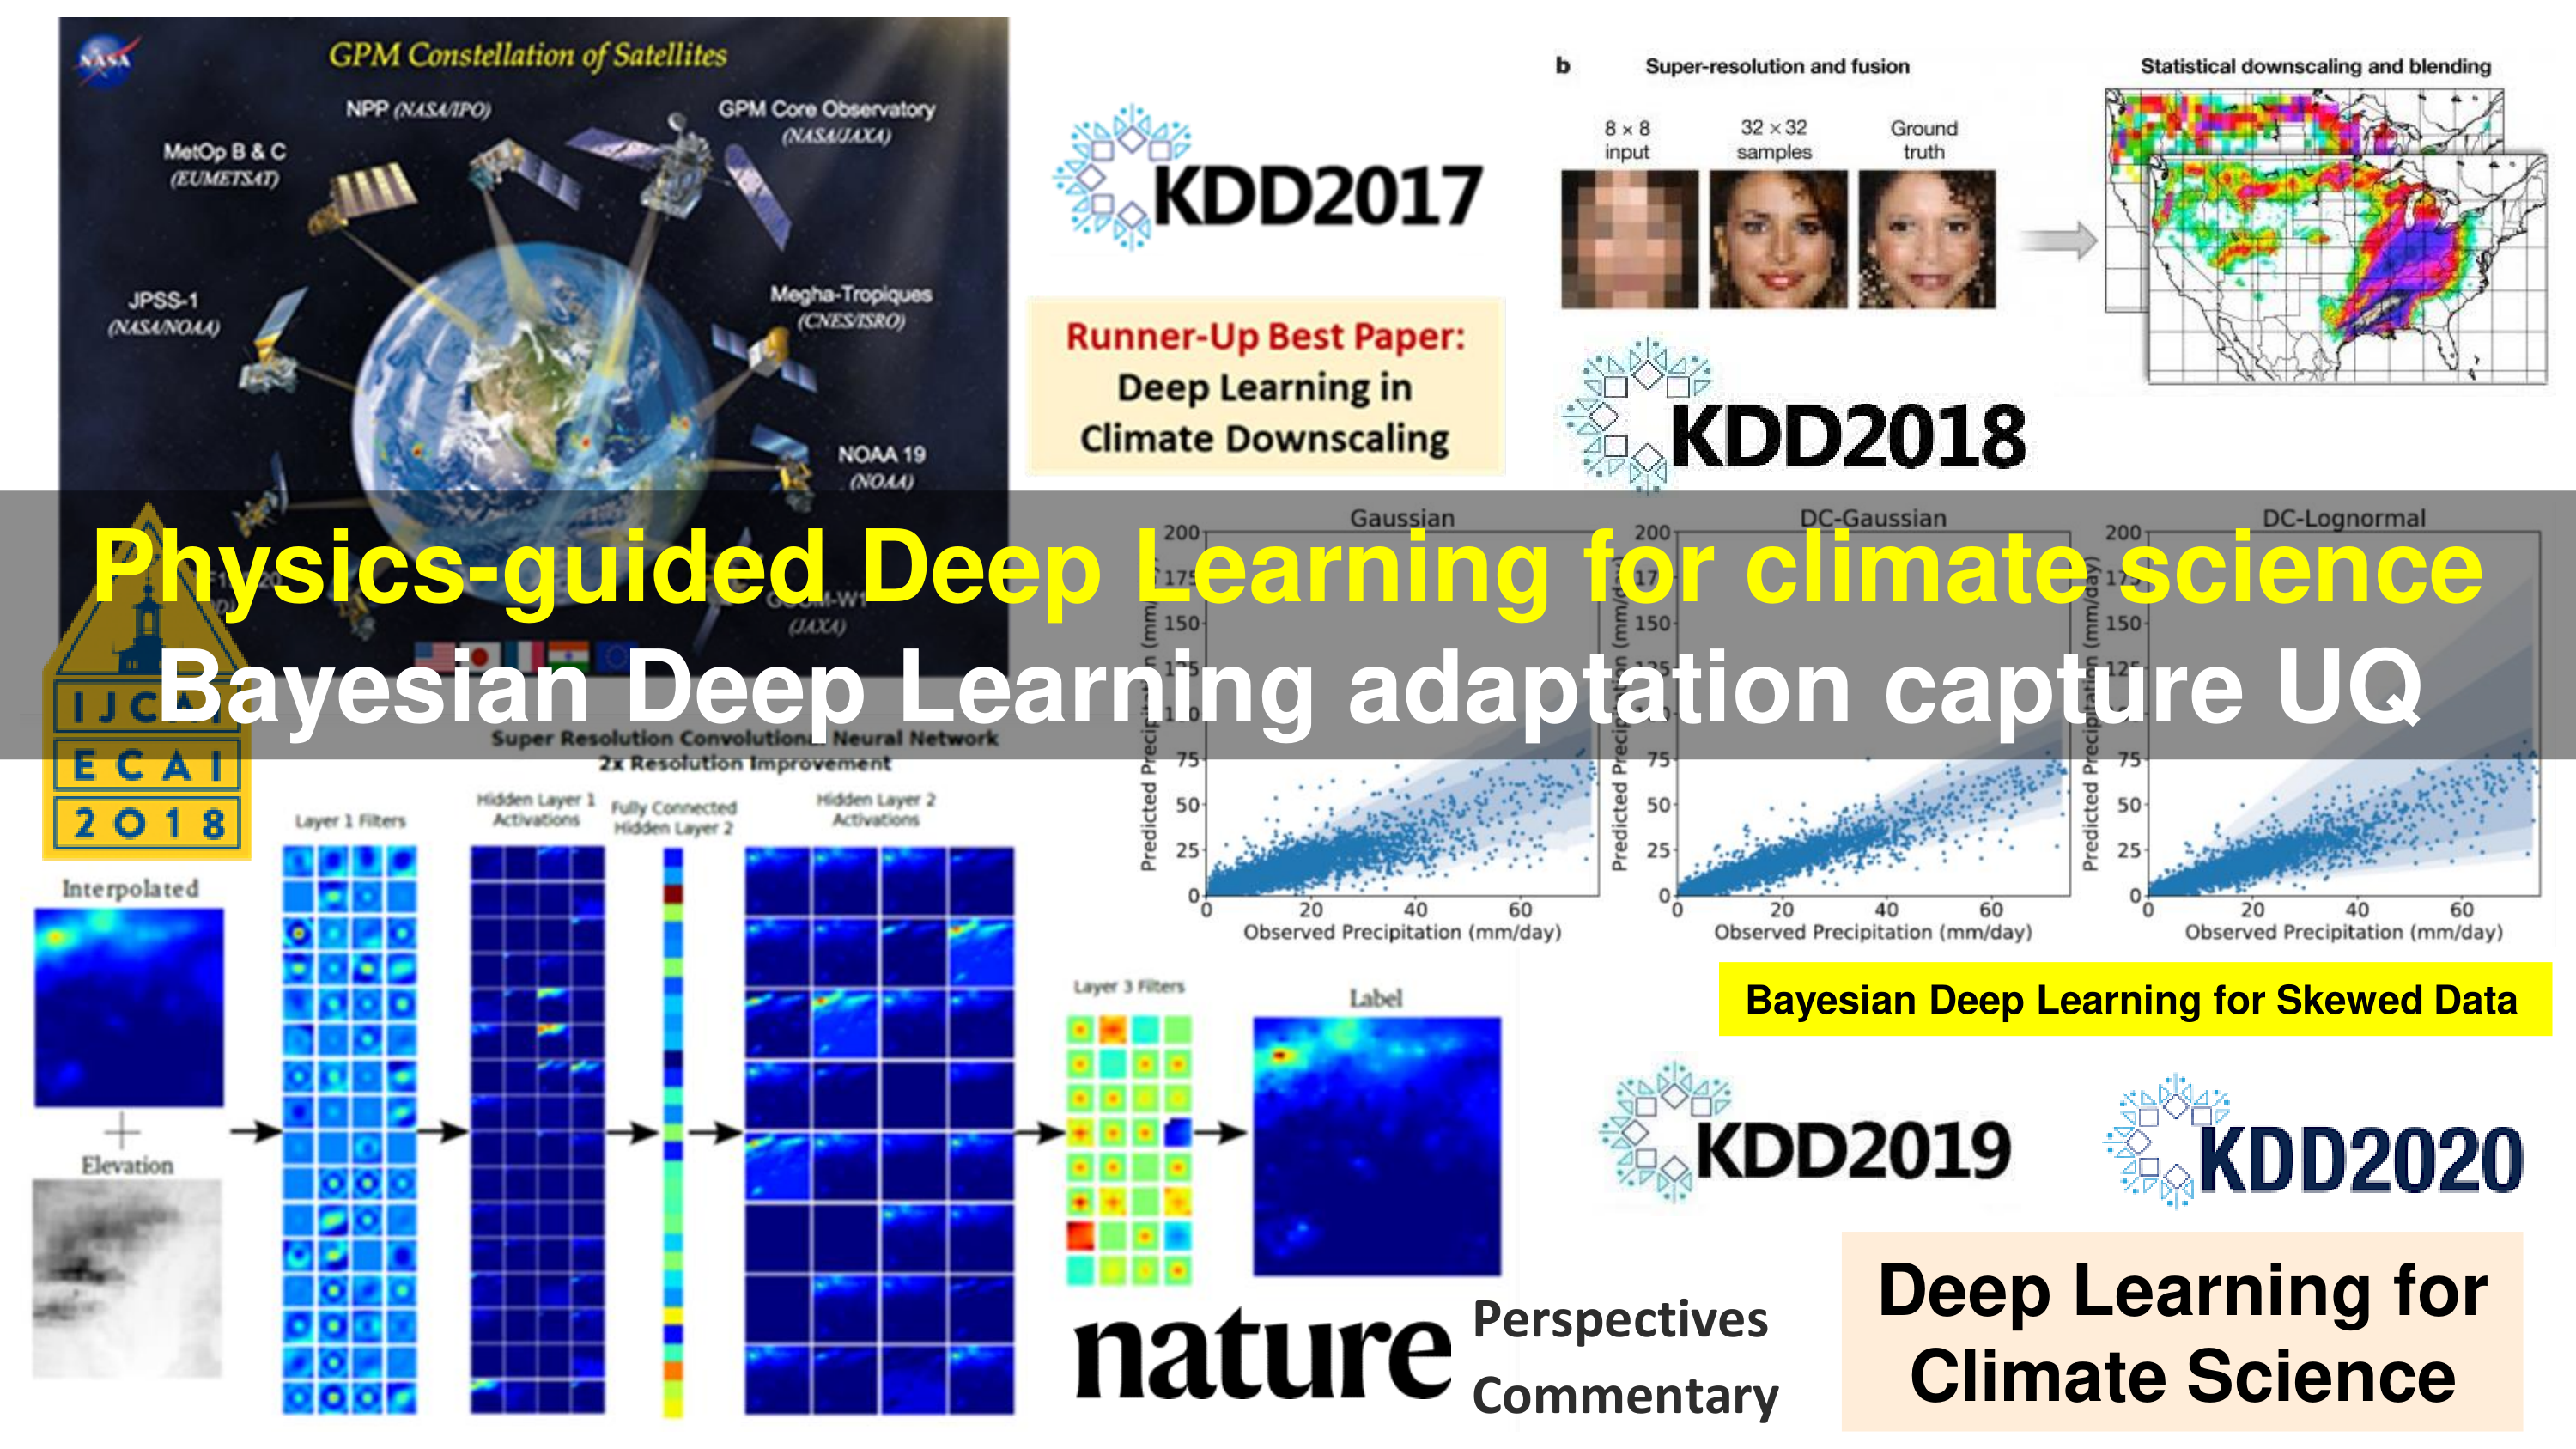
The impacts of climate change are felt by most critical systems, such as infrastructure, ecological systems, and power-plants. However,contemporary Earth System Models (ESM) are run at spatial resolutions too coarse for assessing effects this localized. Local scale projections can be obtained using statistical downscaling, a technique which uses historical climate observations to learn a low-resolution to high-resolution mapping. Depending on statistical modeling choices, downscaled projections have been shown to vary significantly terms of accuracy and reliability. The spatio-temporal nature of the climate system motivates the adaptation of super-resolution image processing techniques to statistical downscaling. In our work, we present DeepSD, a generalized stacked super resolution convolutional neural network (SRCNN) framework for statistical downscaling of climate variables. DeepSD augments SRCNN with multi-scale input channels to maximize predictability in statistical downscaling. We provide a comparison with Bias Correction Spatial Disaggregation as well as three Automated-Statistical Downscaling approaches in downscaling daily precipitation from 1 degree ( 100km) to 1/8 degrees ( 12.5km) over the Continental United States.Furthermore, a framework using the NASA Earth Exchange (NEX) platform is discussed for downscaling more than 20 ESM models with multiple emission scenarios.
Thomas Vandal, Evan Kodra, Sangram Ganguly, Andrew Michaelis, Ramakrishna Nemani, Auroop R Ganguly
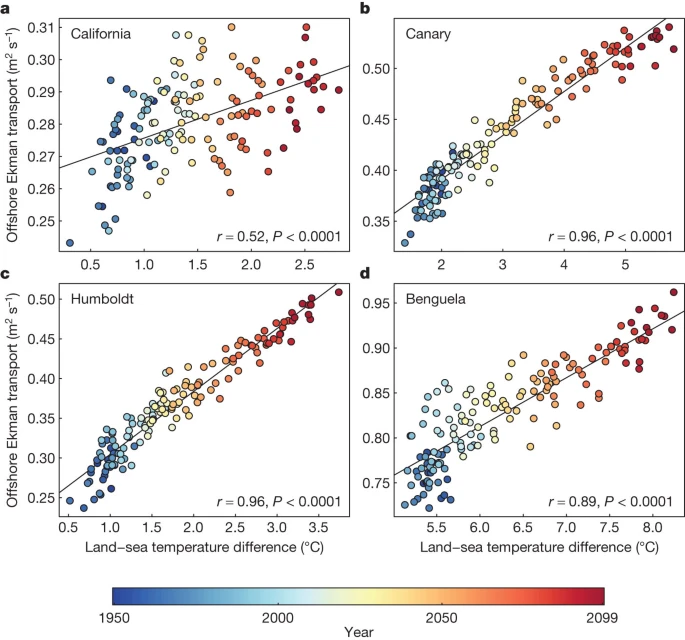
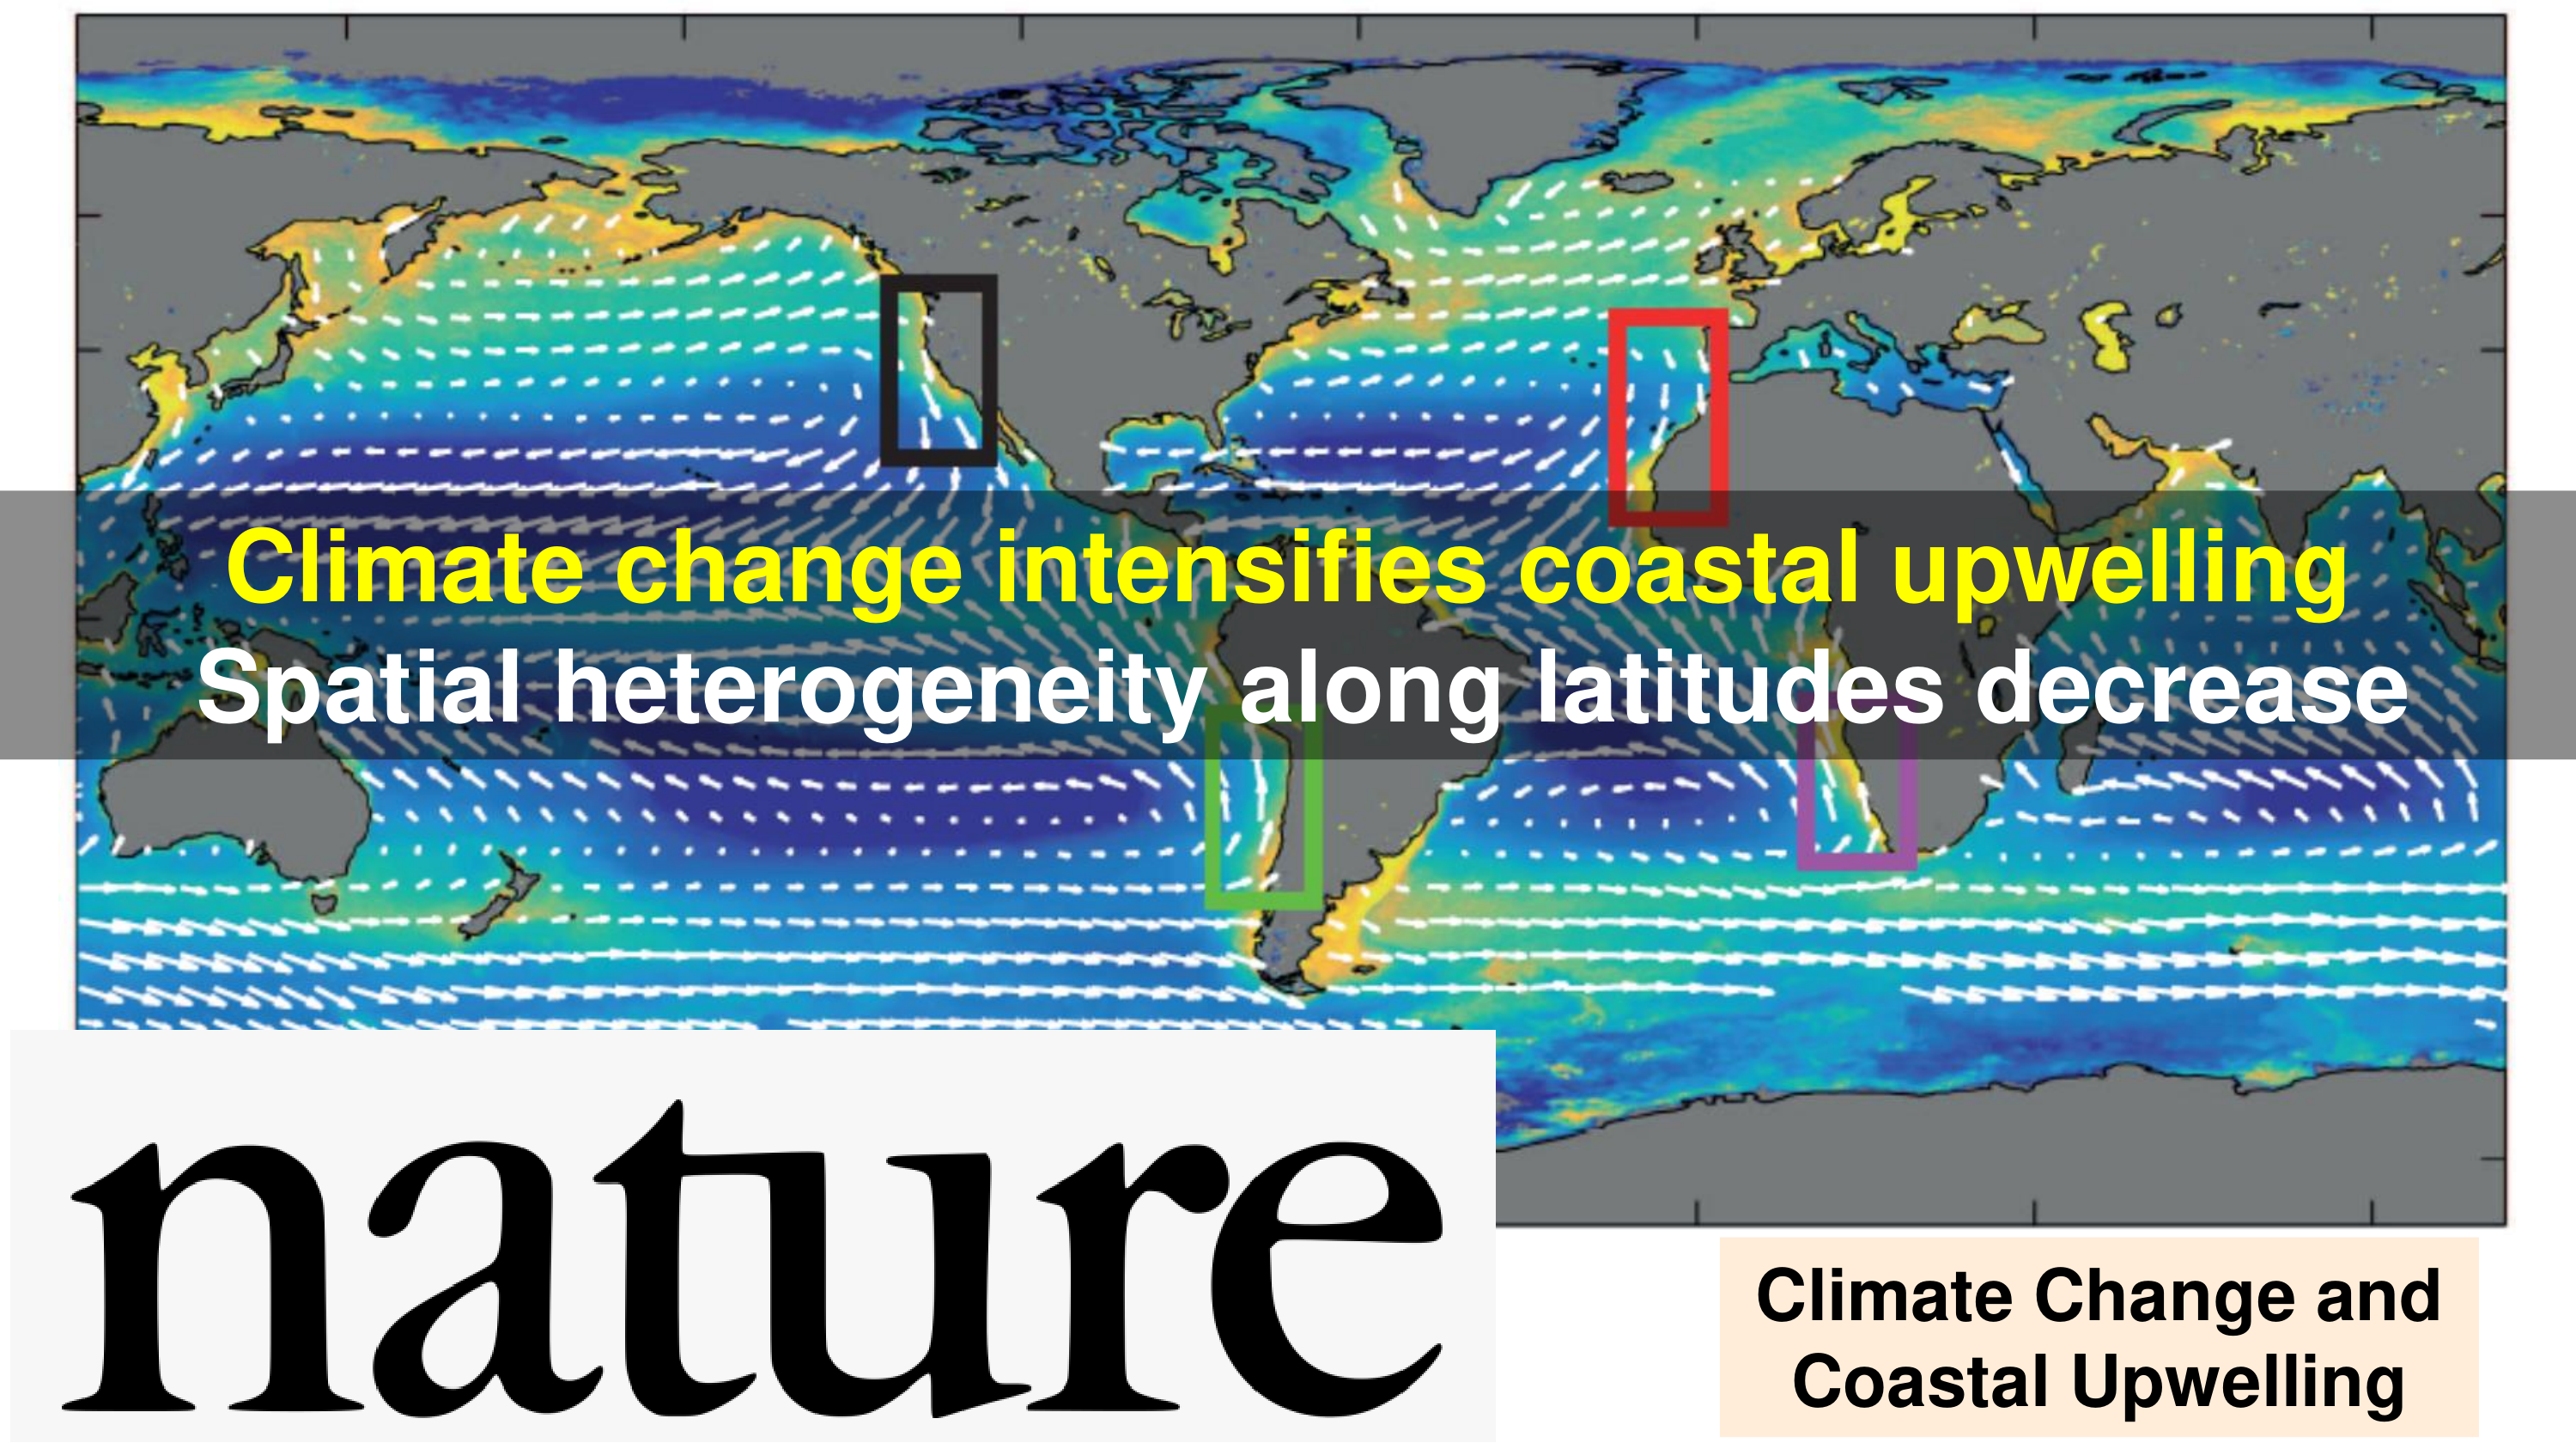
The timing and strength of wind-driven coastal upwelling along the eastern margins of major ocean basins regulate the productivity of critical fisheries and marine ecosystems by bringing deep and nutrient-rich waters to the sunlit surface, where photosynthesis can occur. How coastal upwelling regimes might change in a warming climate is therefore a question of vital importance. Although enhanced land–ocean differential heating due to greenhouse warming has been proposed to intensify coastal upwelling by strengthening alongshore winds, analyses of observations and previous climate models have provided little consensus on historical and projected trends in coastal upwelling. Here we show that there are strong and consistent changes in the timing, intensity and spatial heterogeneity of coastal upwelling in response to future warming in most Eastern Boundary Upwelling Systems (EBUSs). An ensemble of climate models shows that by the end of the twenty-first century the upwelling season will start earlier, end later and become more intense at high but not low latitudes. This projected increase in upwelling intensity and duration at high latitudes will result in a substantial reduction of the existing latitudinal variation in coastal upwelling. These patterns are consistent across three of the four EBUSs (Canary, Benguela and Humboldt, but not California). The lack of upwelling intensification and greater uncertainty associated with the California EBUS may reflect regional controls associated with the atmospheric response to climate change. Given the strong linkages between upwelling and marine ecosystems the projected changes in the intensity, timing and spatial structure of coastal upwelling may influence the geographical distribution of marine biodiversity.
Daiwei Wang, Tarik C. Gouhier, Bruce A. Menge & Auroop R. Ganguly
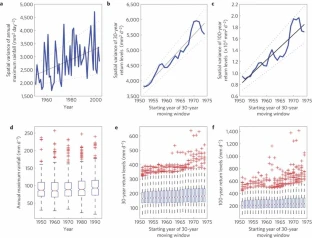
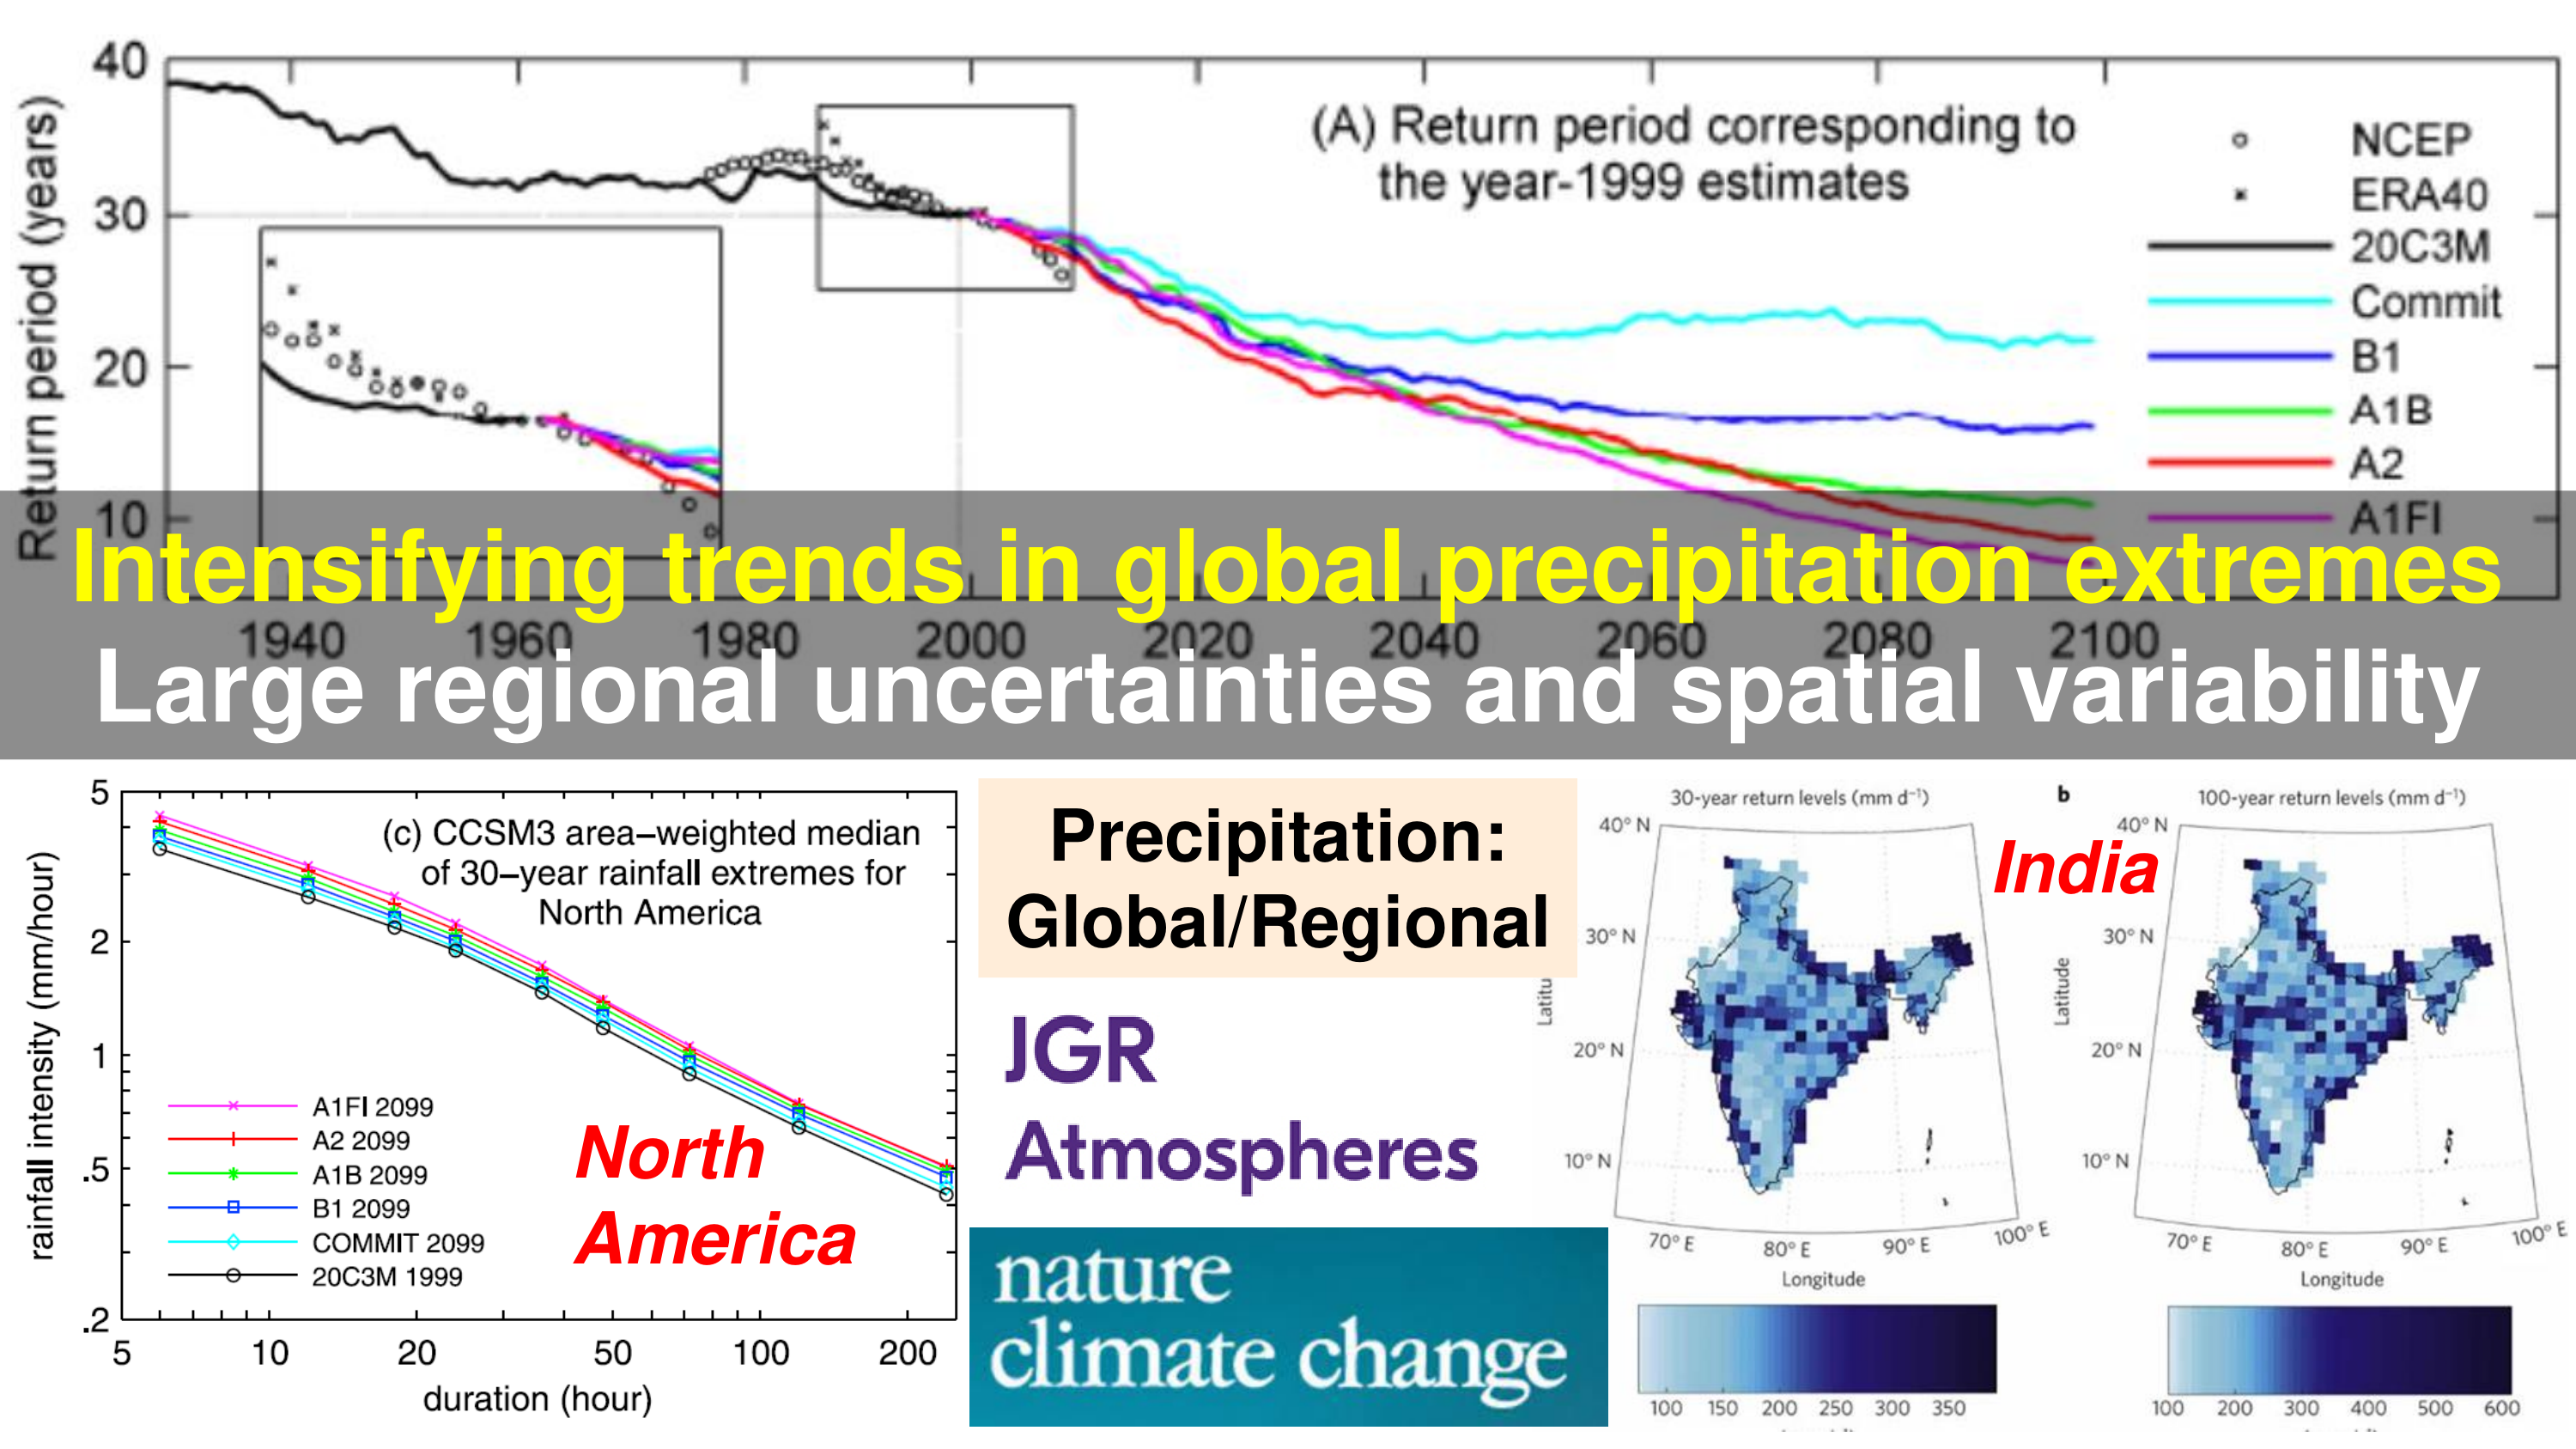
Recent studies disagree on how rainfall extremes over India have changed in space and time over the past half century as well as on whether the changes observed are due to global warming or regional urbanization7. Although a uniform and consistent decrease in moderate rainfall has been reported a lack of agreement about trends in heavy rainfall may be due in part to differences in the characterization and spatial averaging of extremes. Here we use extreme value theory to examine trends in Indian rainfall over the past half century in the context of long-term, low-frequency variability. We show that when generalized extreme value theory is applied to annual maximum rainfall over India, no statistically significant spatially uniform trends are observed, in agreement with previous studies using different approaches. Furthermore, our space–time regression analysis of the return levels points to increasing spatial variability of rainfall extremes over India. Our findings highlight the need for systematic examination of global versus regional drivers of trends in Indian rainfall extremes, and may help to inform flood hazard preparedness and water resource management in the region.
Subimal Ghosh, Debasish Das, Shih-Chieh Kao , Auroop R. Ganguly
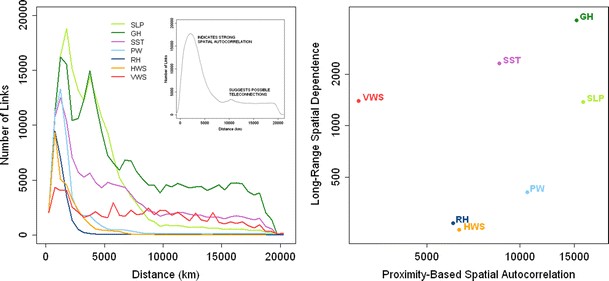
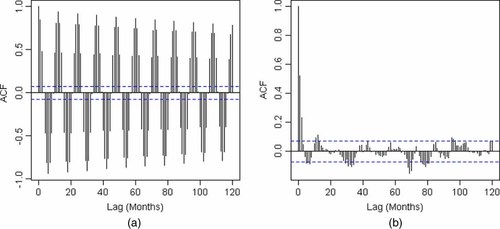
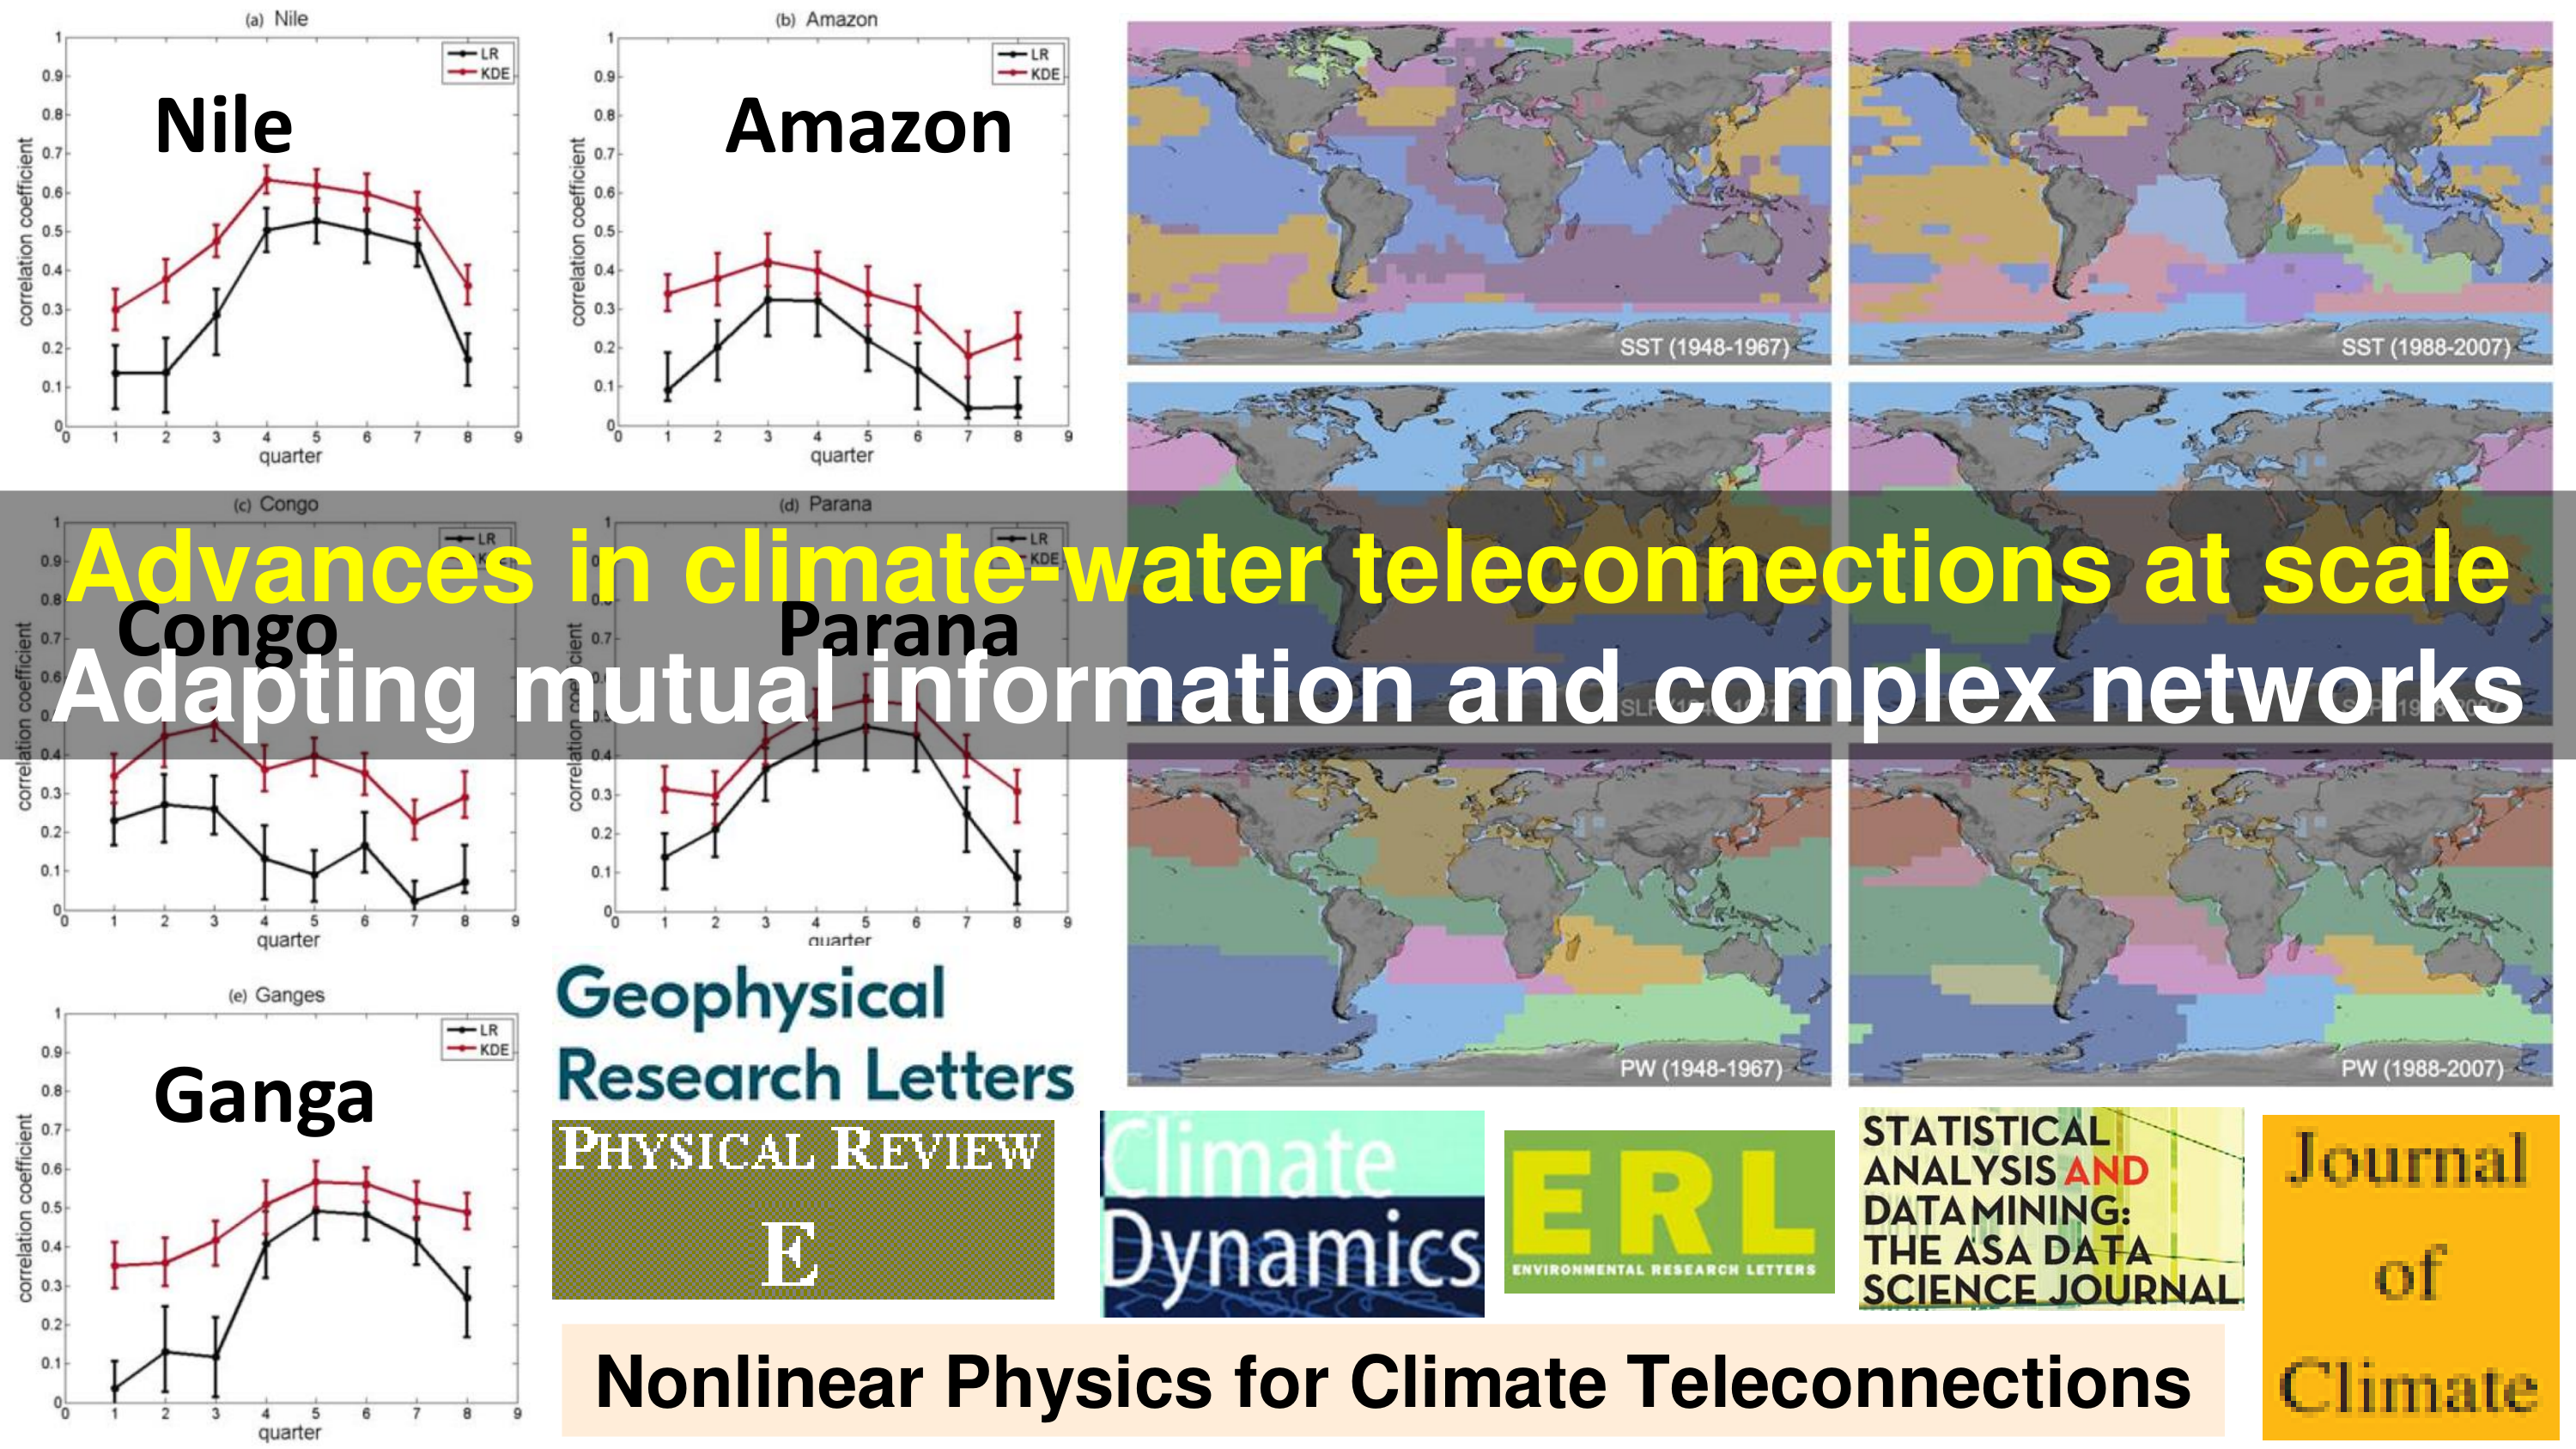
A systematic characterization of multivariate dependence at multiple spatio-temporal scales is critical to understanding climate system dynamics and improving predictive ability from models and data. However, dependence structures in climate are complex due to nonlinear dynamical generating processes, long-range spatial and long-memory temporal relationships, as well as low-frequency variability. Here we utilize complex networks to explore dependence in climate data. Specifically, networks constructed from reanalysis-based atmospheric variables over oceans and partitioned with community detection methods demonstrate the potential to capture regional and global dependence structures within and among climate variables. Proximity-based dependence as well as long-range spatial relationships are examined along with their evolution over time, yielding new insights on ocean meteorology. The tools are implicitly validated by confirming conceptual understanding about aggregate correlations and teleconnections. Our results also suggest a close similarity of observed dependence patterns in relative humidity and horizontal wind speed over oceans. In addition, updraft velocity, which relates to convective activity over the oceans, exhibits short spatiotemporal decorrelation scales but long-range dependence over time. The multivariate and multi-scale dependence patterns broadly persist over multiple time windows. Our findings motivate further investigations of dependence structures among observations, reanalysis and model-simulated data to enhance process understanding, assess model reliability and improve regional climate predictions.
Karsten Steinhaeuser, Auroop R. Ganguly, Nitesh V. Chawla
The analysis of climate data has relied heavily on hypothesis-driven statistical methods, while projections of future climate are based primarily on physics-based computational models. However, in recent years a wealth of new datasets has become available. Therefore, we take a more data-centric approach and propose a unified framework for studying climate, with an aim toward characterizing observed phenomena as well as discovering new knowledge in climate science. Specifically, we posit that complex networks are well suited for both descriptive analysis and predictive modeling tasks. We show that the structural properties of ‘climate networks’ have useful interpretation within the domain. Further, we extract clusters from these networks and demonstrate their predictive power as climate indices. Our experimental results establish that the network clusters are statistically significantly better predictors than clusters derived using a more traditional clustering approach. Using complex networks as data representation thus enables the unique opportunity for descriptive and predictive modeling to inform each other.
Karsten Steinhaeuser, Nitesh V. Chawla, Auroop R. Ganguly
Statistical Analysis and Data Mining, 2010
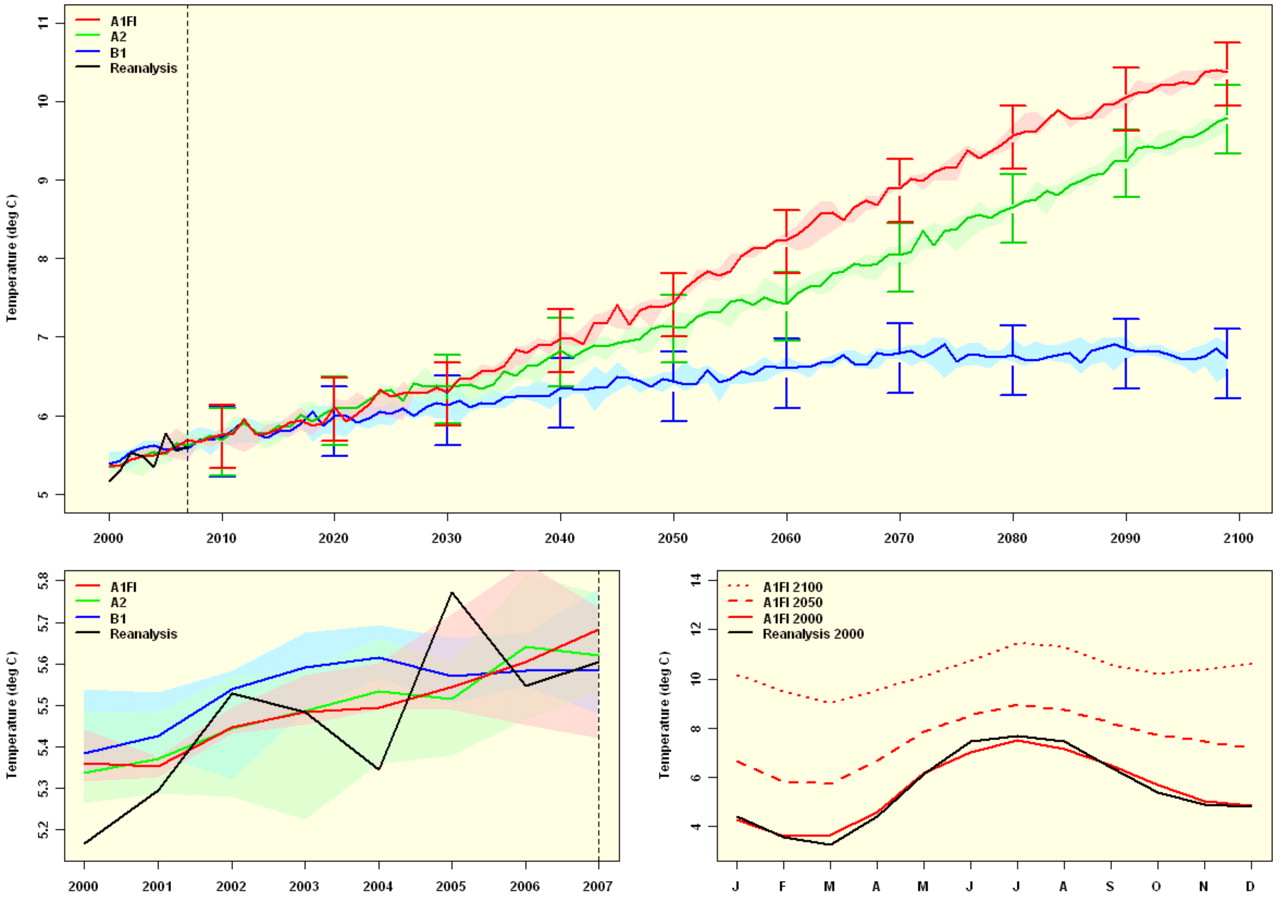
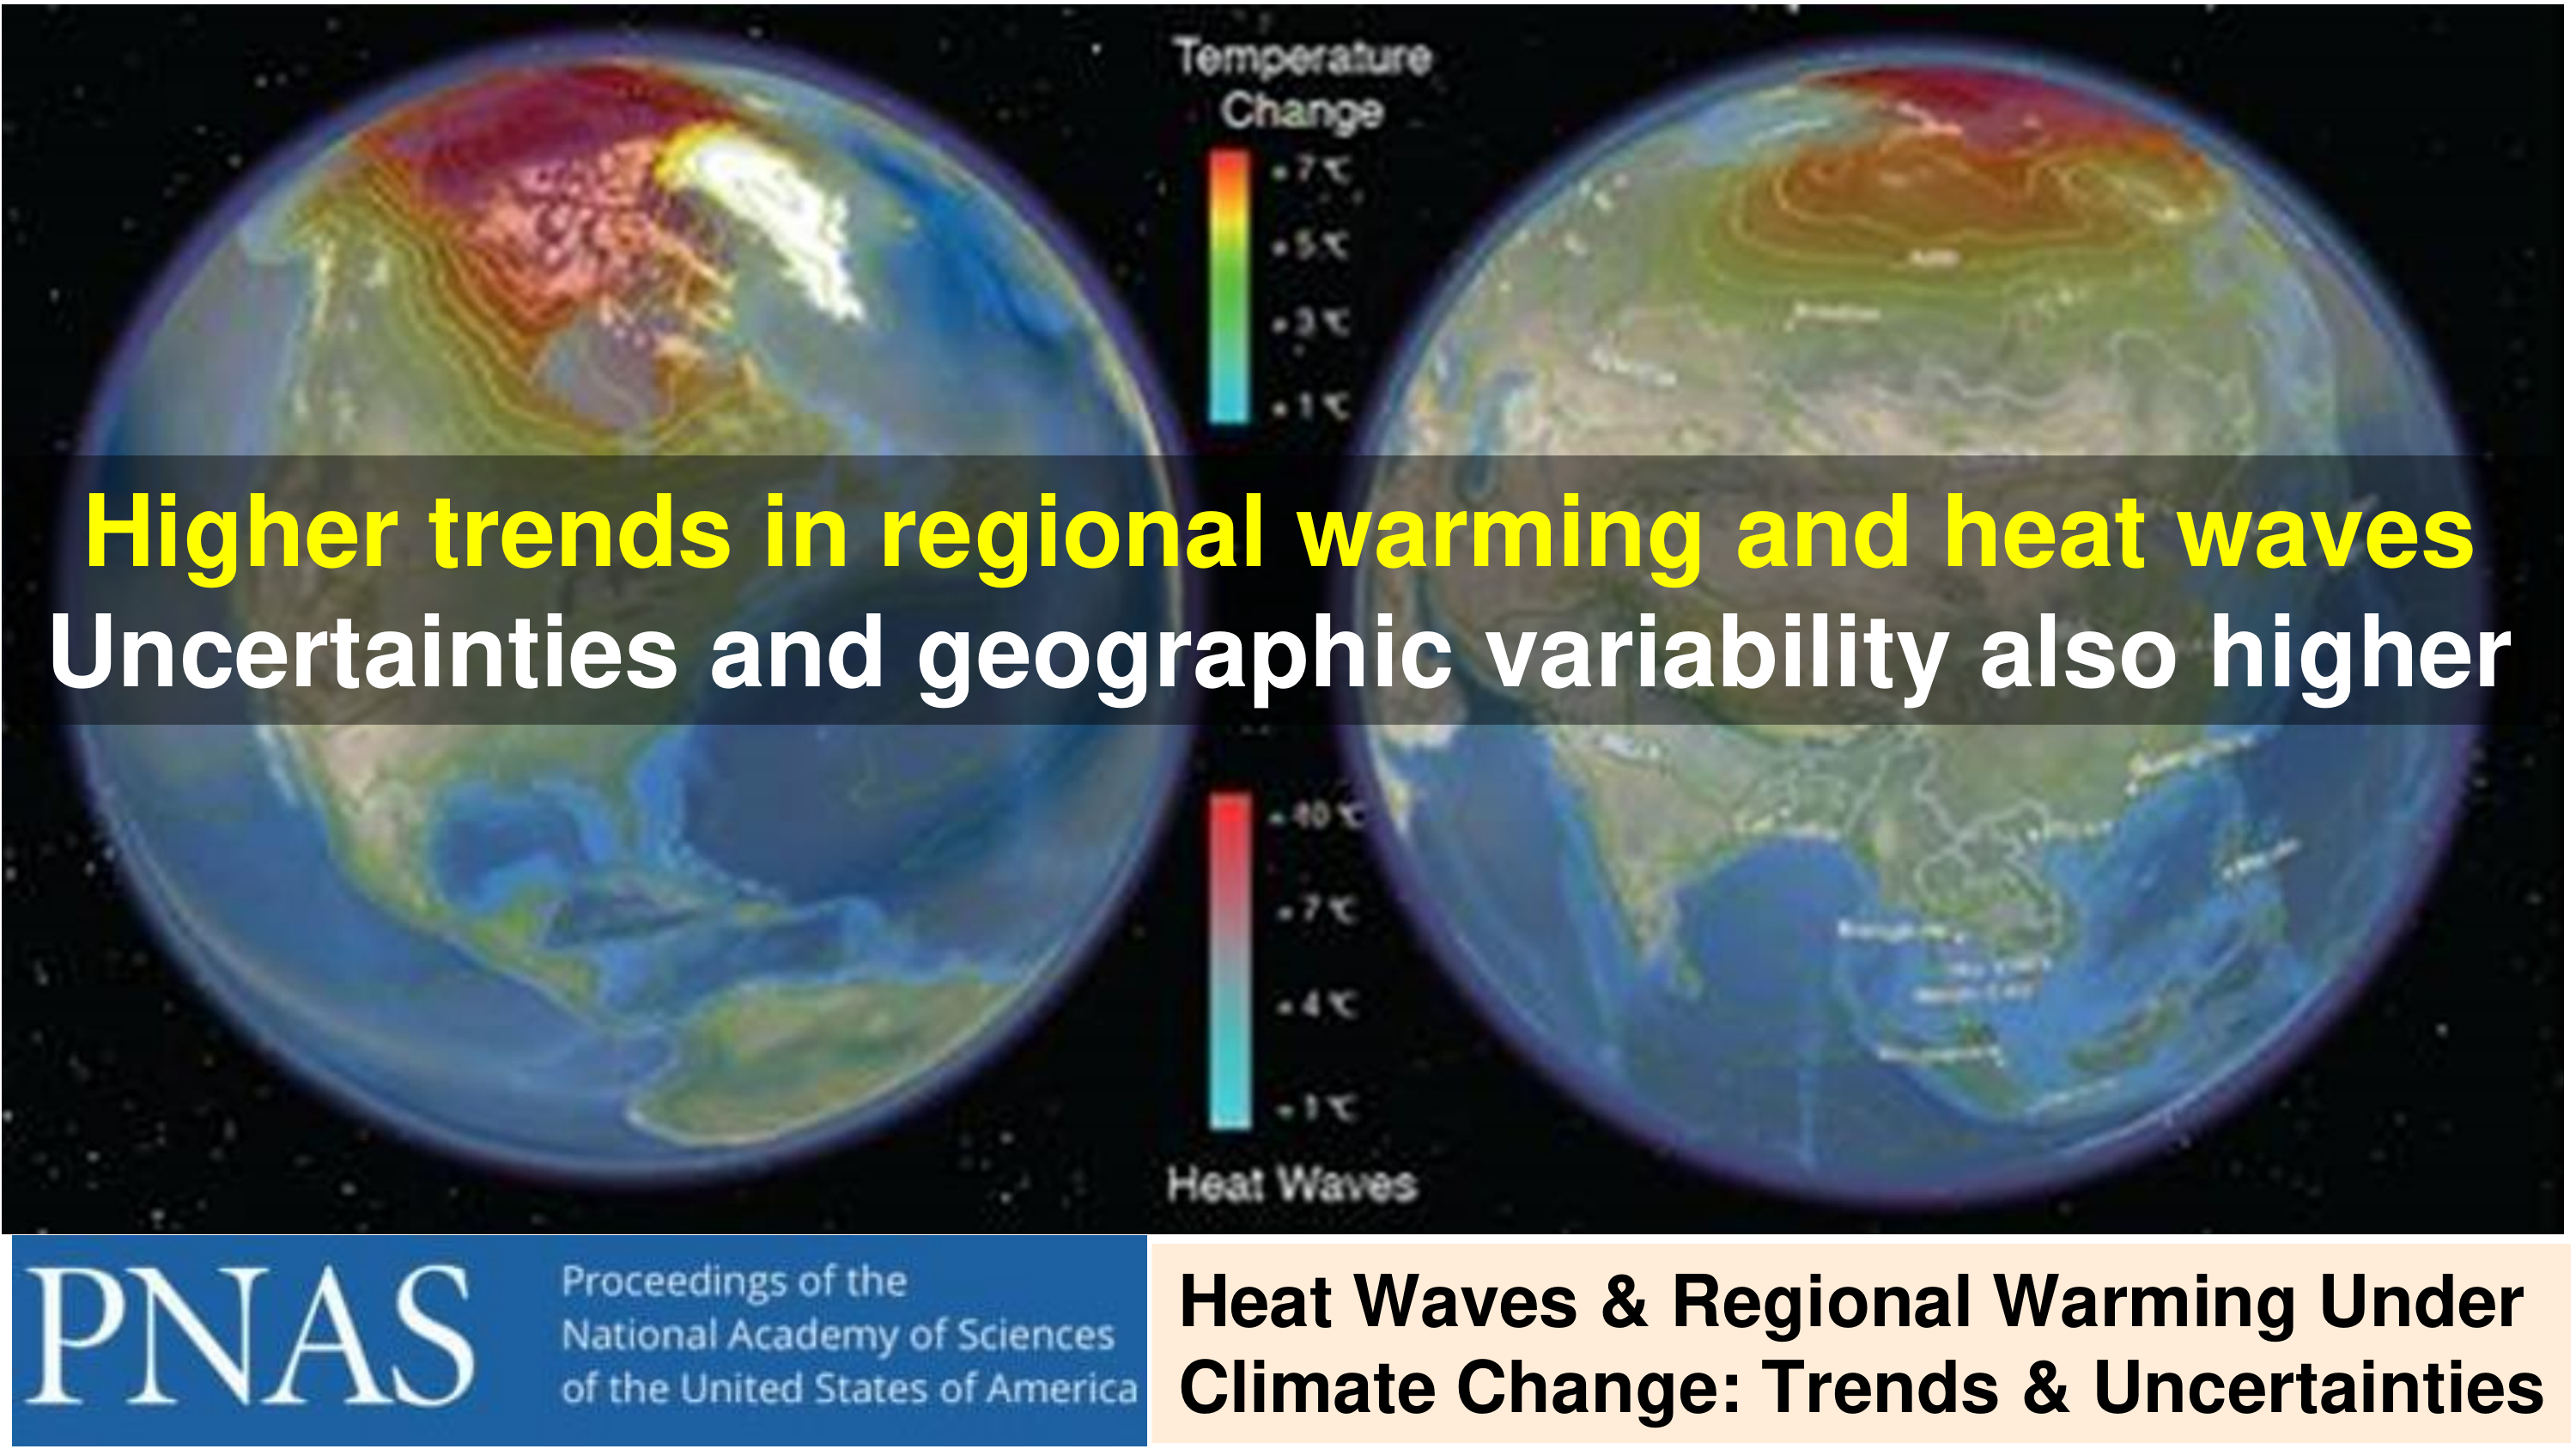
Generating credible climate change and extremes projections remains a high-priority challenge, especially since recent observed emissions are above the worst-case scenario. Bias and uncertainty analyses of ensemble simulations from a global earth systems model show increased warming and more intense heat waves combined with greater uncertainty and large regional variability in the 21st century. Global warming trends are statistically validated across ensembles and investigated at regional scales. Observed heat wave intensities in the current decade are larger than worst-case projections. Model projections are relatively insensitive to initial conditions, while uncertainty bounds obtained by comparison with recent observations are wider than ensemble ranges. Increased trends in temperature and heat waves, concurrent with larger uncertainty and variability, suggest greater urgency and complexity of adaptation or mitigation decisions.
Nishant Yadav, Samrat Chatterjee , Auroop R. Ganguly

Selected Publications and Links
- Slide 1: SDS Lab -- Lab PI, Spinout, Patents/Books, and Grand Challenges
- PI Auroop Ganguly Websites: Northeastern University; SDS Lab; Wikipedia; ASCE; NSF News; NSF Media; DoD NICE; KDD Award; Best Posters (AMS; AGU)
- SDS Lab: Primary website; NU site; SDS spinout risQ (News: Business Wire; Politico; Bond Buyer; Breckenridge ESG; NSF SBIR: Phase I and Phase II)
- US Patents: Climate Risk (NU News) and Network Resilience (NU News)
- Textbook: Critical Infrastructure Resilience (Taylor & Francis; Amazon) and Book Interview (Big Data journal)
- Edited Books and Reports: Knowledge Discovery from Sensor Data (Edition 1; Edition 2) with ACM SIGKDD Explorations reports (2008; 2009; 2010); Agent-Based Modeling (Book; Chapter)
- Grand Challenge: (1) US DOE AI4ESP white paper: Science-integrated Artificial-intelligence for Flooding and precipitation Extremes (SAFE)
- Grand Challenge: (2) Frontiers in Water Specialty Chief Editor's column: Water and the Built Environment
- Grand Challenge: (3) Climate Resilience and Data Driven Solutions: UNA-UK Climate 2020 Data Driven Solutions (Article and Demo: Fig. 2) and Sustained National Climate Assessment (SCAN, History, WSC Paper: full version; BAMS Paper: summary)
- Slide 2: Heat Waves and Climate Change
- PNAS paper: Ganguly, A.R., Steinhaeuser, K.*, Erickson, D.J., Branstetter, M., Parish, E.S., Singh, N., Drake, J.B. and Buja, L., 2009. Higher trends but larger uncertainty and geographic variability in 21st century temperature and heat waves . Proceedings of the National Academy of Sciences, 106(37), 15555-15559.
- Slide 3: Cold Snaps and Climate Change
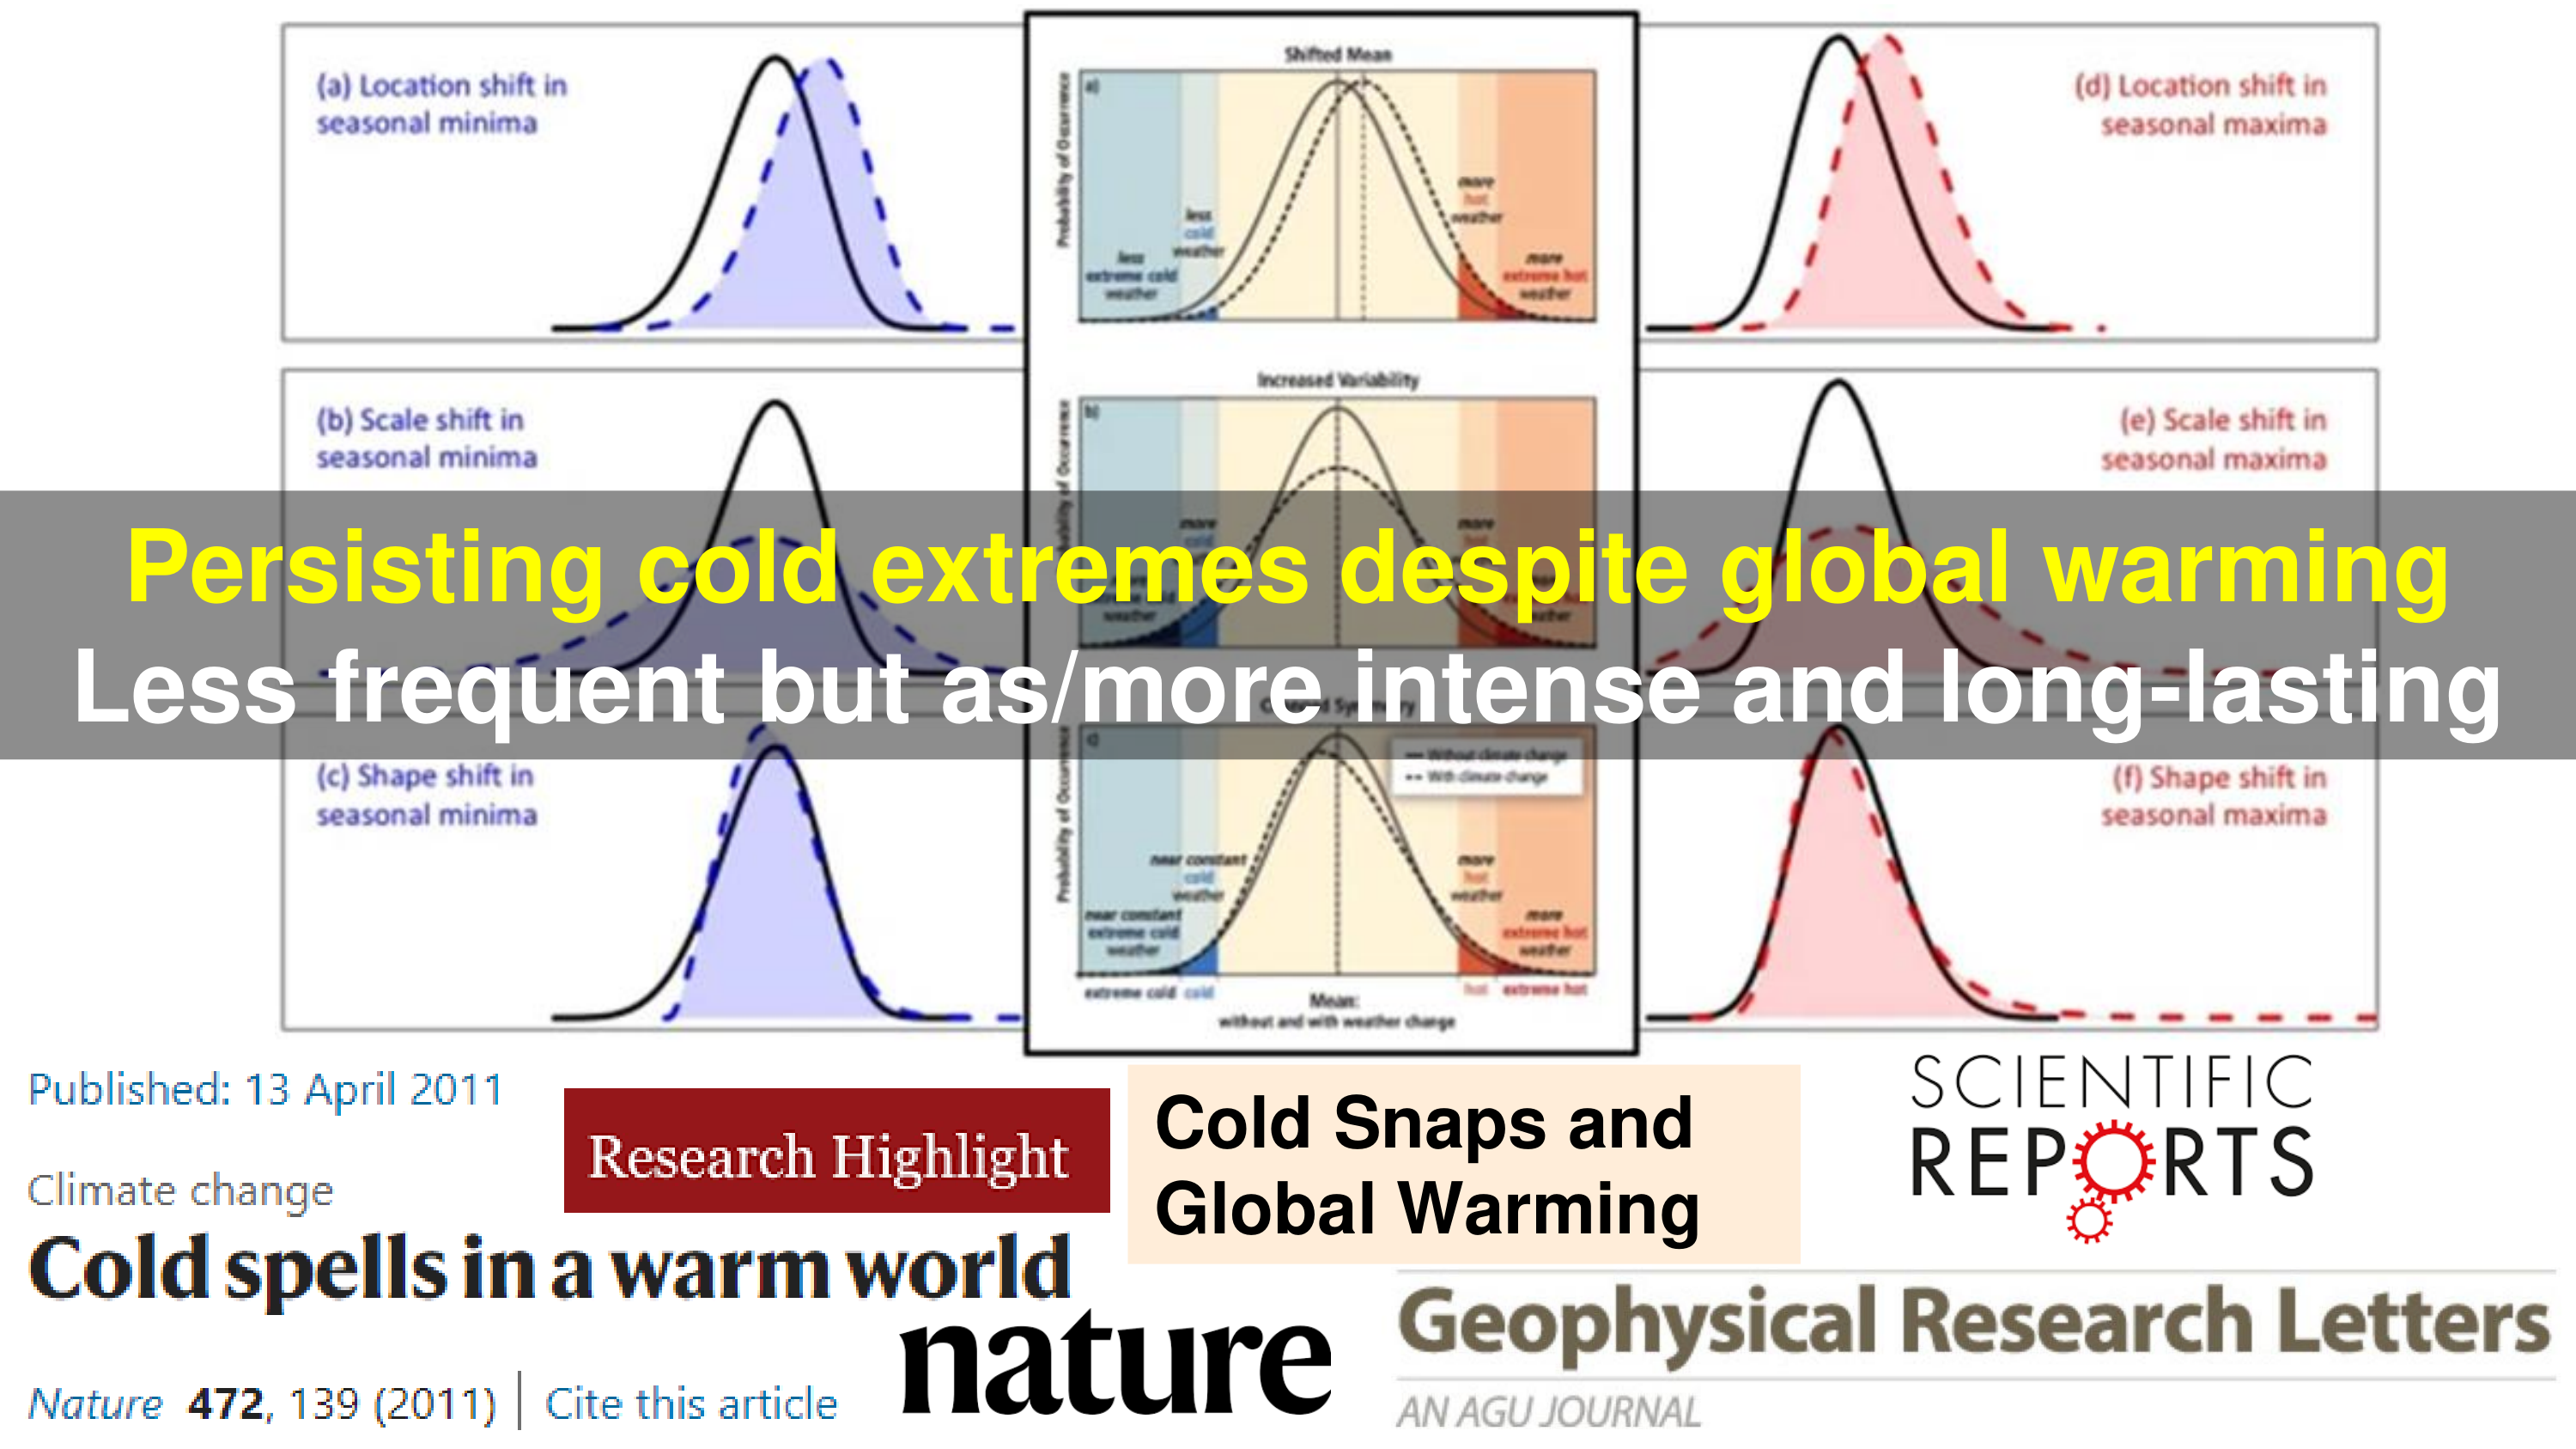
- GRL paper: Kodra, E.*, Steinhaeuser, K.* and Ganguly, A.R., 2011. Persisting cold extremes under 21st ‐ century warming scenarios . Geophysical Research Letters, 38(8).
- Nature research highlight: Cold spells in a warm world. Nature 472, 139 (2011).
- Scientific Reports paper: Kodra, E.* and Ganguly, A.R., 2014. Asymmetry of projected increases in extreme temperature distributions . Scientific Reports, 4, 5884.
- Slide 4: Heavy Precipitation (Extremes) and Climate Change
- JGR paper: Kao, S.C.* and Ganguly, A.R., 2011. Intensity, duration, and frequency of precipitation extremes under 21st ‐ century warming scenarios . Journal of Geophysical Research: Atmospheres, 116(D16).
- Nature Climate Change paper: Ghosh, S.*, Das, D.*, Kao, S.C.* and Ganguly, A.R., 2012. Lack of uniform trends but increasing spatial variability in observed Indian rainfall extremes . Nature Climate Change, 2, 86-91.
- JGR paper: Mishra, V., Kumar, D.*, Ganguly, A.R., Sanjay, J., Mujumdar, M., Krishnan, R. and Shah, R.D., 2014. Reliability of regional and global climate models to simulate precipitation extremes over India . Journal of Geophysical Research: Atmospheres, 119(15), pp.9301-9323.
- Slide 5: Coastal Upwelling and Climate Change
- Nature paper: Wang, D.*, Gouhier, T.C., Menge, B.A. and Ganguly, A.R., 2015. Intensification and spatial homogenization of coastal upwelling under climate change . Nature, 518(7539), 390-394.
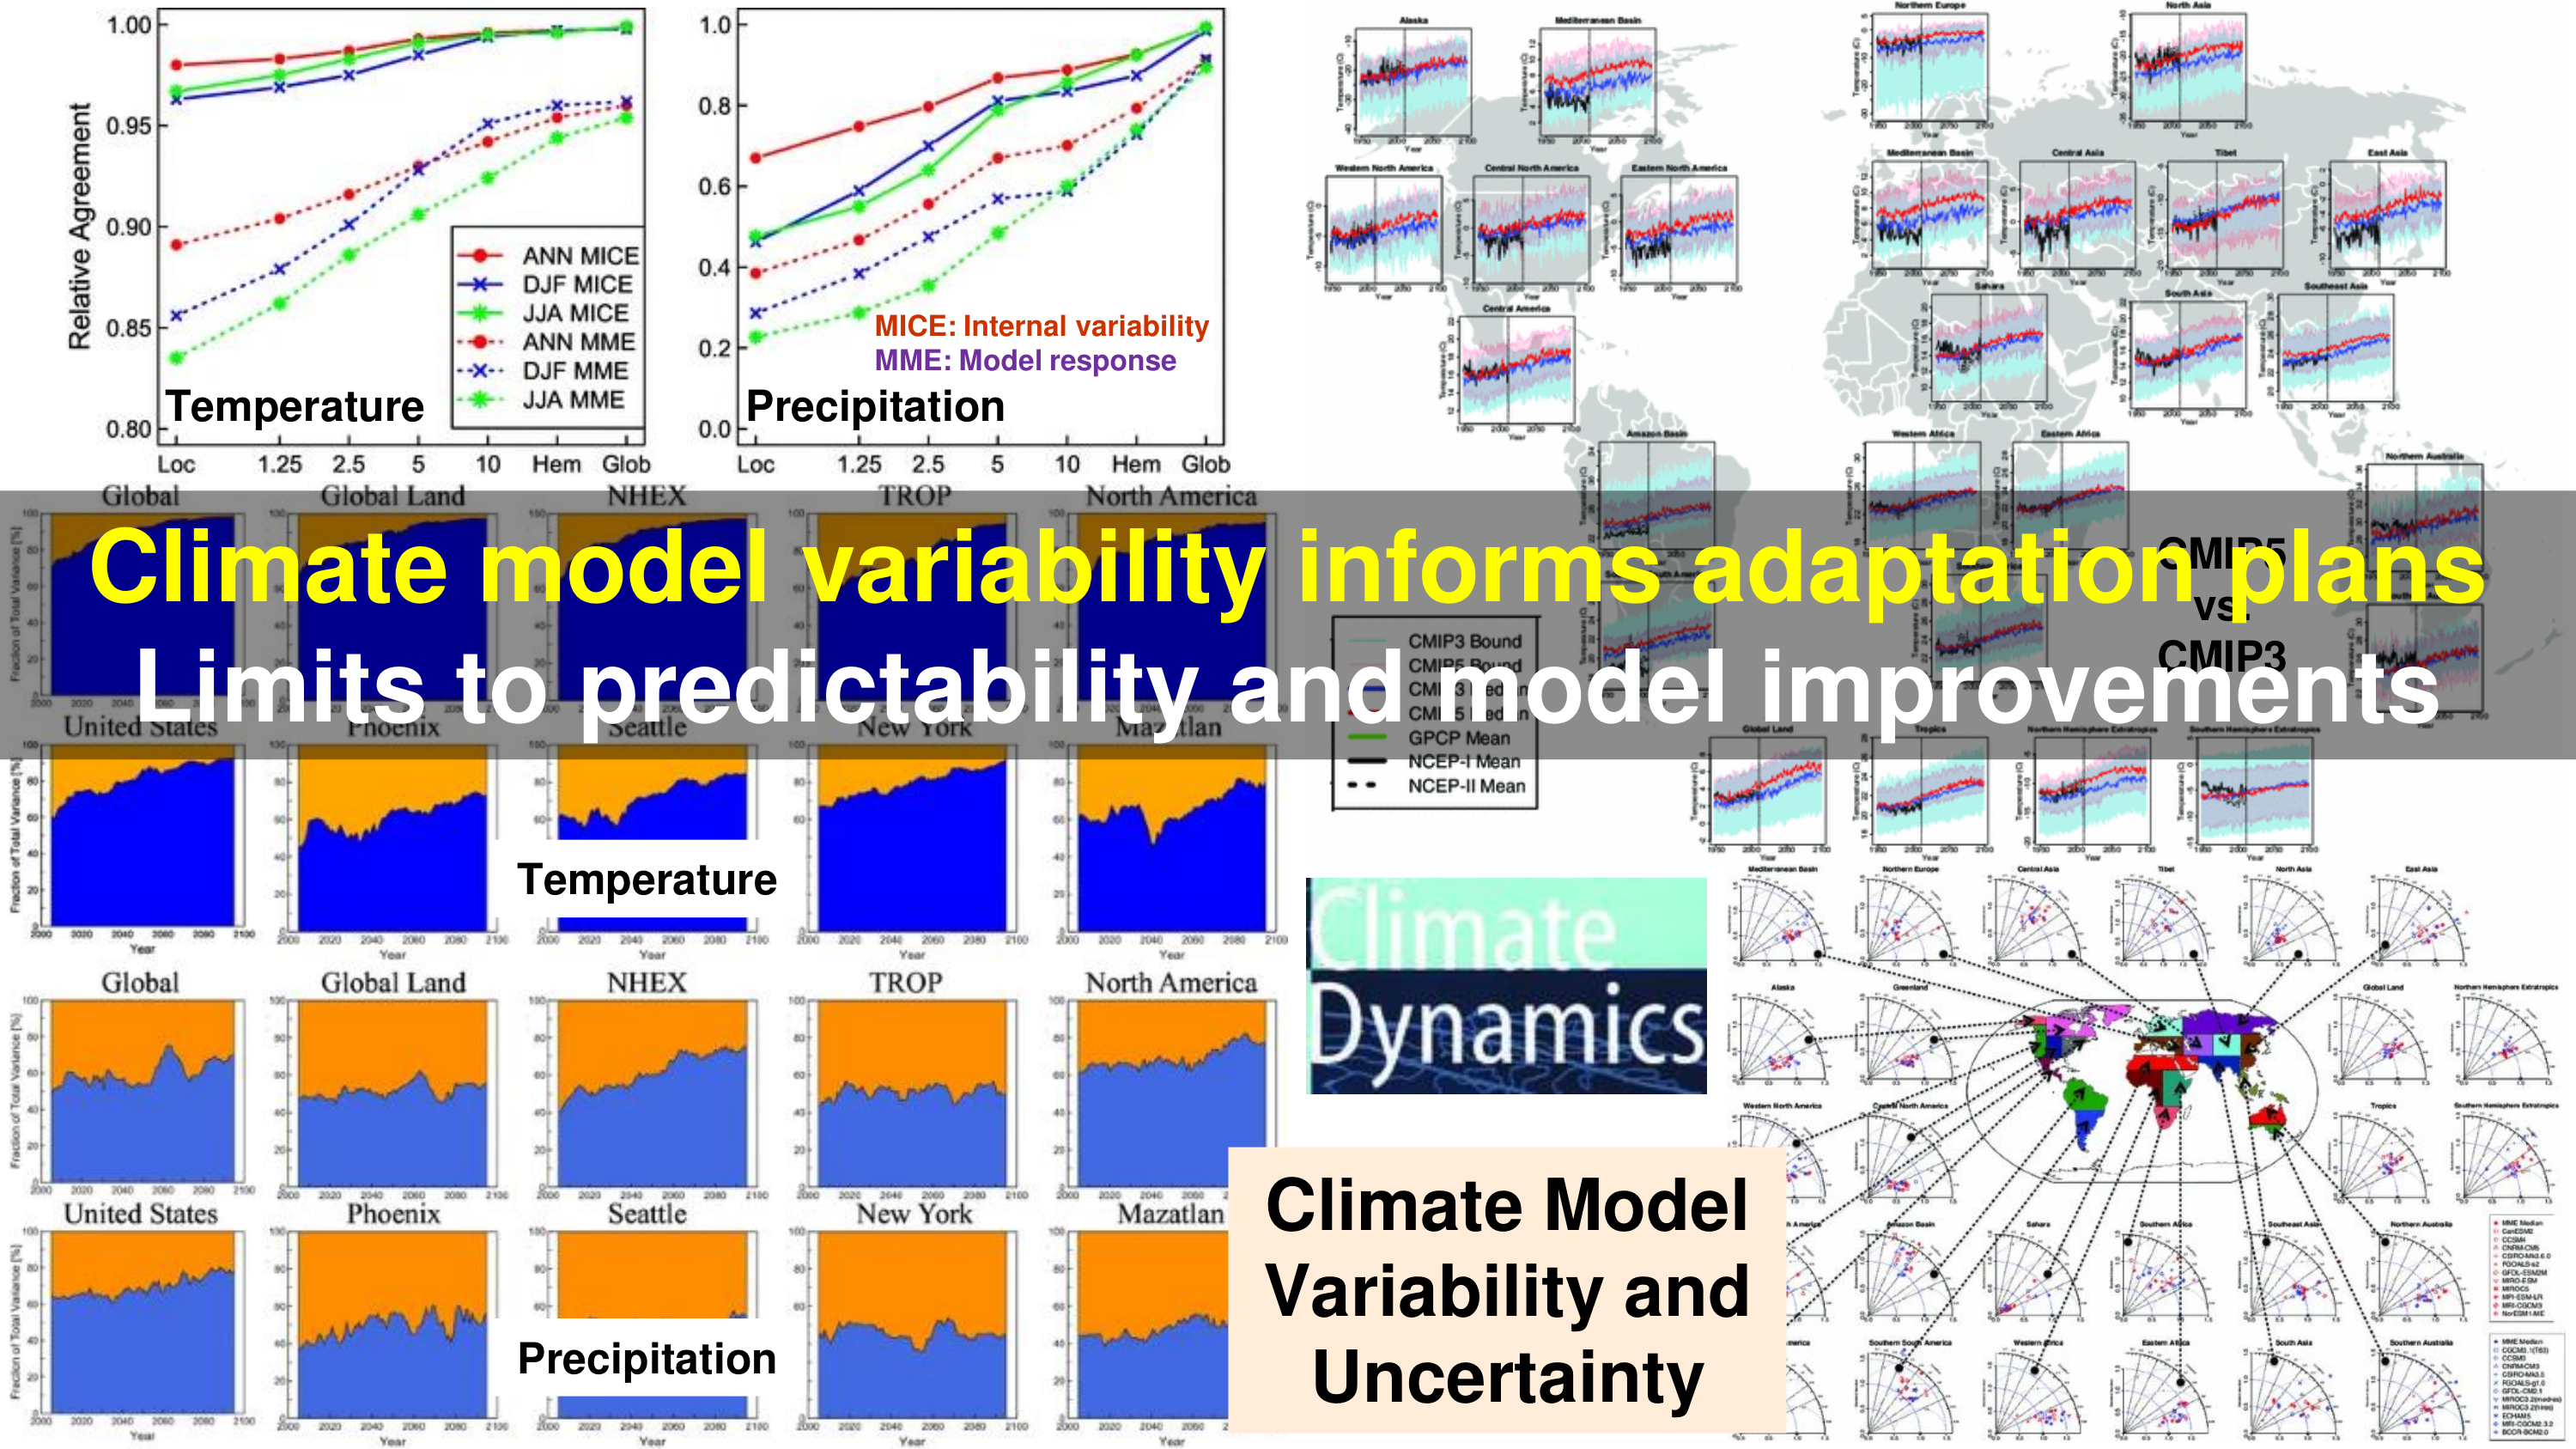
- Slide 6: Earth System Model Intercomparison and Internal Variability
- Climate Dynamics paper: Kumar, D.* and Ganguly, A.R., 2018. Intercomparison of model response and internal variability across climate model ensembles . Climate Dynamics, 51(1), 207-219.
- Climate Dynamics paper: Kumar, D.*, Kodra, E.* and Ganguly, A.R., 2014. Regional and seasonal intercomparison of CMIP3 and CMIP5 climate model ensembles for temperature and precipitation . Climate Dynamics, 43(9-10), 2491-2518.
- Slide 7: Climate Teleconnections and Complex Dependence
- Climate Dynamics paper: Steinhaeuser, K.*, Ganguly, A.R. and Chawla, N.V., 2012. Multivariate and multiscale dependence in the global climate system revealed through complex networks . Climate Dynamics, 39(3-4), 889-895.
- SADM paper: Steinhaeuser, K.*, Chawla, N.V. and Ganguly, A.R., 2011. Complex networks as a unified framework for descriptive analysis and predictive modeling in climate science . Statistical Analysis and Data Mining: The ASA Data Science Journal, 4(5), 497-511.
- J. Climate paper: Liess, S., Kumar, A., Snyder, P.K., Kawale, J., Steinhaeuser, K., Semazzi, F.H.M., Ganguly, A.R., Samatova, N.F. and Kumar, V., 2014. Different Modes of Variability over the Tasman Sea: Implications for Regional Climate . Journal of Climate, 27(22), 8466–8486.
- Nature news (citation 2 of 3): Jones, N., 2017. How machine learning could help to improve climate forecasts . Nature 548, 379.
- SADM paper: Kawale, J., Liess, S., Kumar, A., Steinbach, M., Snyder, P., Kumar, V., Ganguly, A.R., Samatova, N.F., Semazzi, F, 2011. A graph-based approach to find teleconnections in climate data . Statistical Analysis and Data Mining: The ASA Data Science Journal, 6(3), 158-179.
- ERL paper: Kodra, E.*, Ghosh, S.* and Ganguly, A.R., 2012. Evaluation of global climate models for Indian monsoon climatology . Environmental Research Letters, 7(1), p.014012.
- GRL paper: Khan, S.*, Ganguly, A.R., Bandyopadhyay, S., Saigal, S., Erickson III, D.J., Protopopescu, V. and Ostrouchov, G., 2006. Nonlinear statistics reveals stronger ties between ENSO and the tropical hydrological cycle . Geophysical Research Letters, 33(24).
- PRE paper: Khan, S.*, Bandyopadhyay, S., Ganguly, A.R., Saigal, S., Erickson III, D.J., Protopopescu, V. and Ostrouchov, G., 2007. Relative performance of mutual information estimation methods for quantifying the dependence among short and noisy data . Physical Review E, 76(2), p.026209.
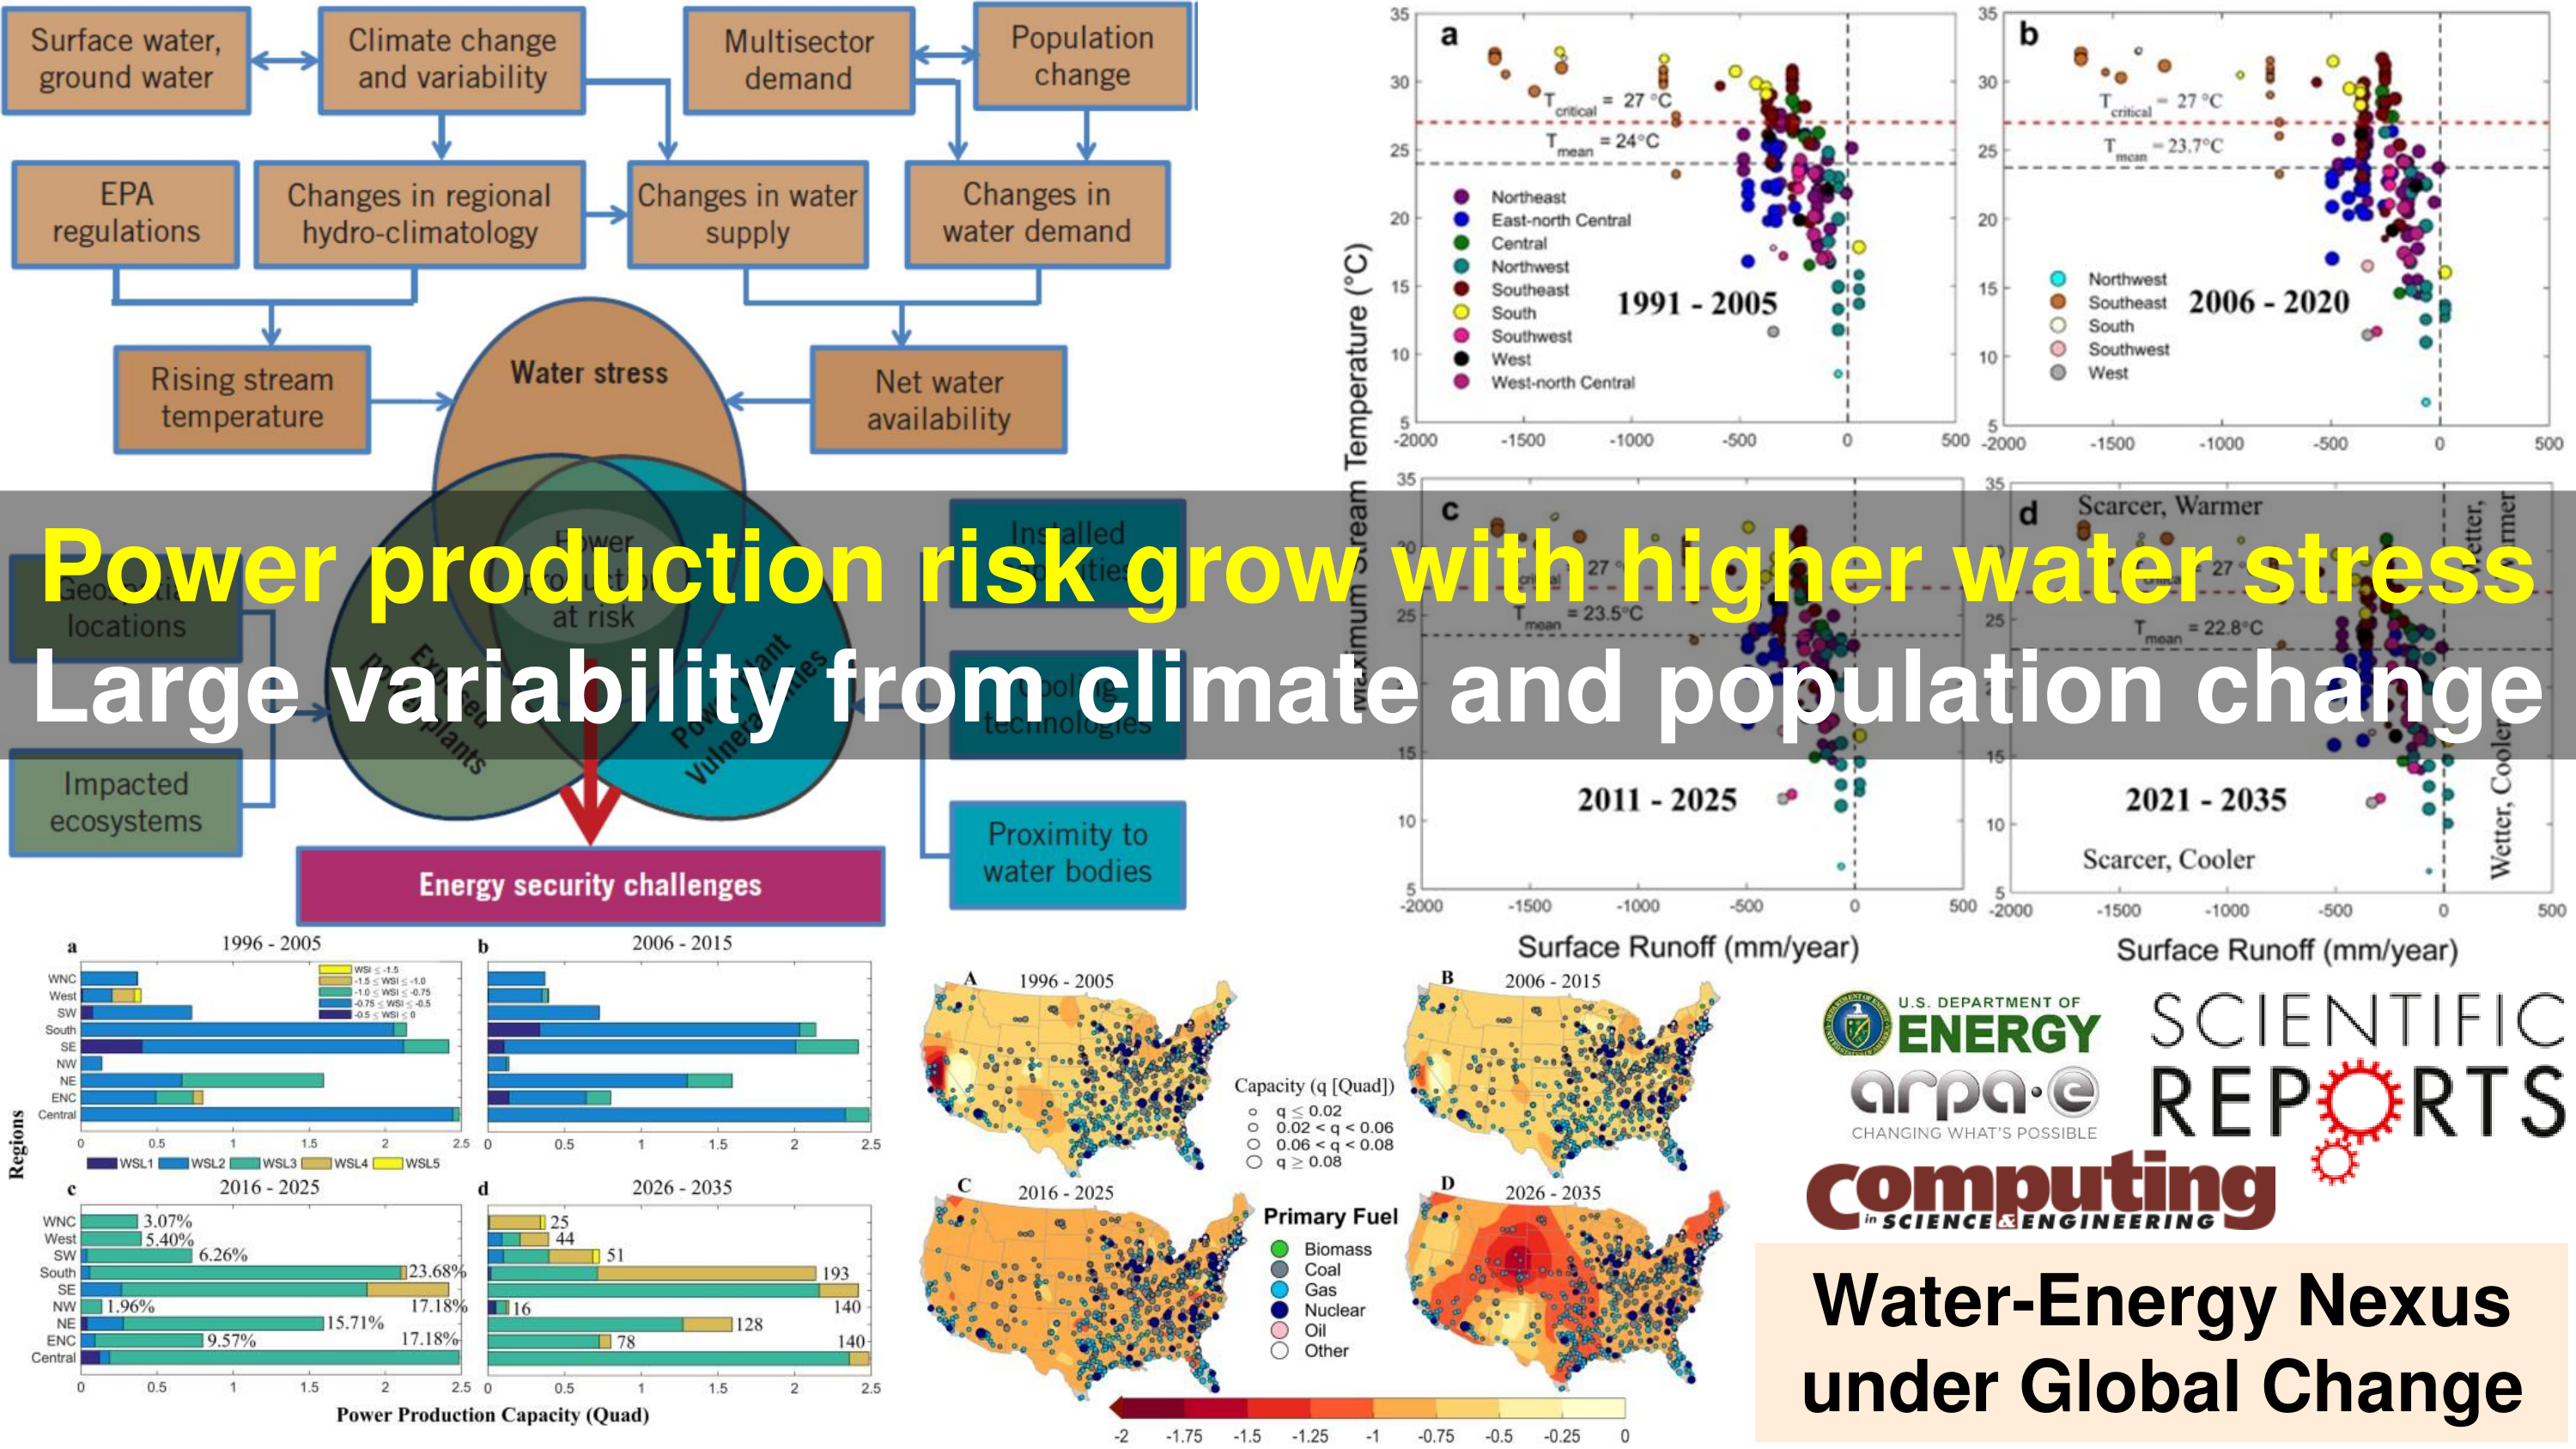
- Slide 8: Climate-Water-Energy Nexus and Climate Adaptation Informatics
- Scientific Reports paper: Ganguli, P.*, Kumar, D.* and Ganguly, A.R., 2017. US power production at risk from water stress in a changing climate . Scientific Reports, 7(1), 11983.
- CiSE paper: Ganguly, A.R., Kumar, D.*, Ganguli, P.*, Short, G. and Klausner, J., 2015. Climate adaptation informatics: water stress on power production . Computing in Science & Engineering, 17(6), pp.53-60.
- ARPA-E FoA: Ganguli, P.*, Kumar, D.* and Ganguly, A.R., 2014: Water Stress on US Power Production at Decadal Time Horizons . Advanced Research Projects Agency – Energy, #DE-AR0000482, 81 pages.
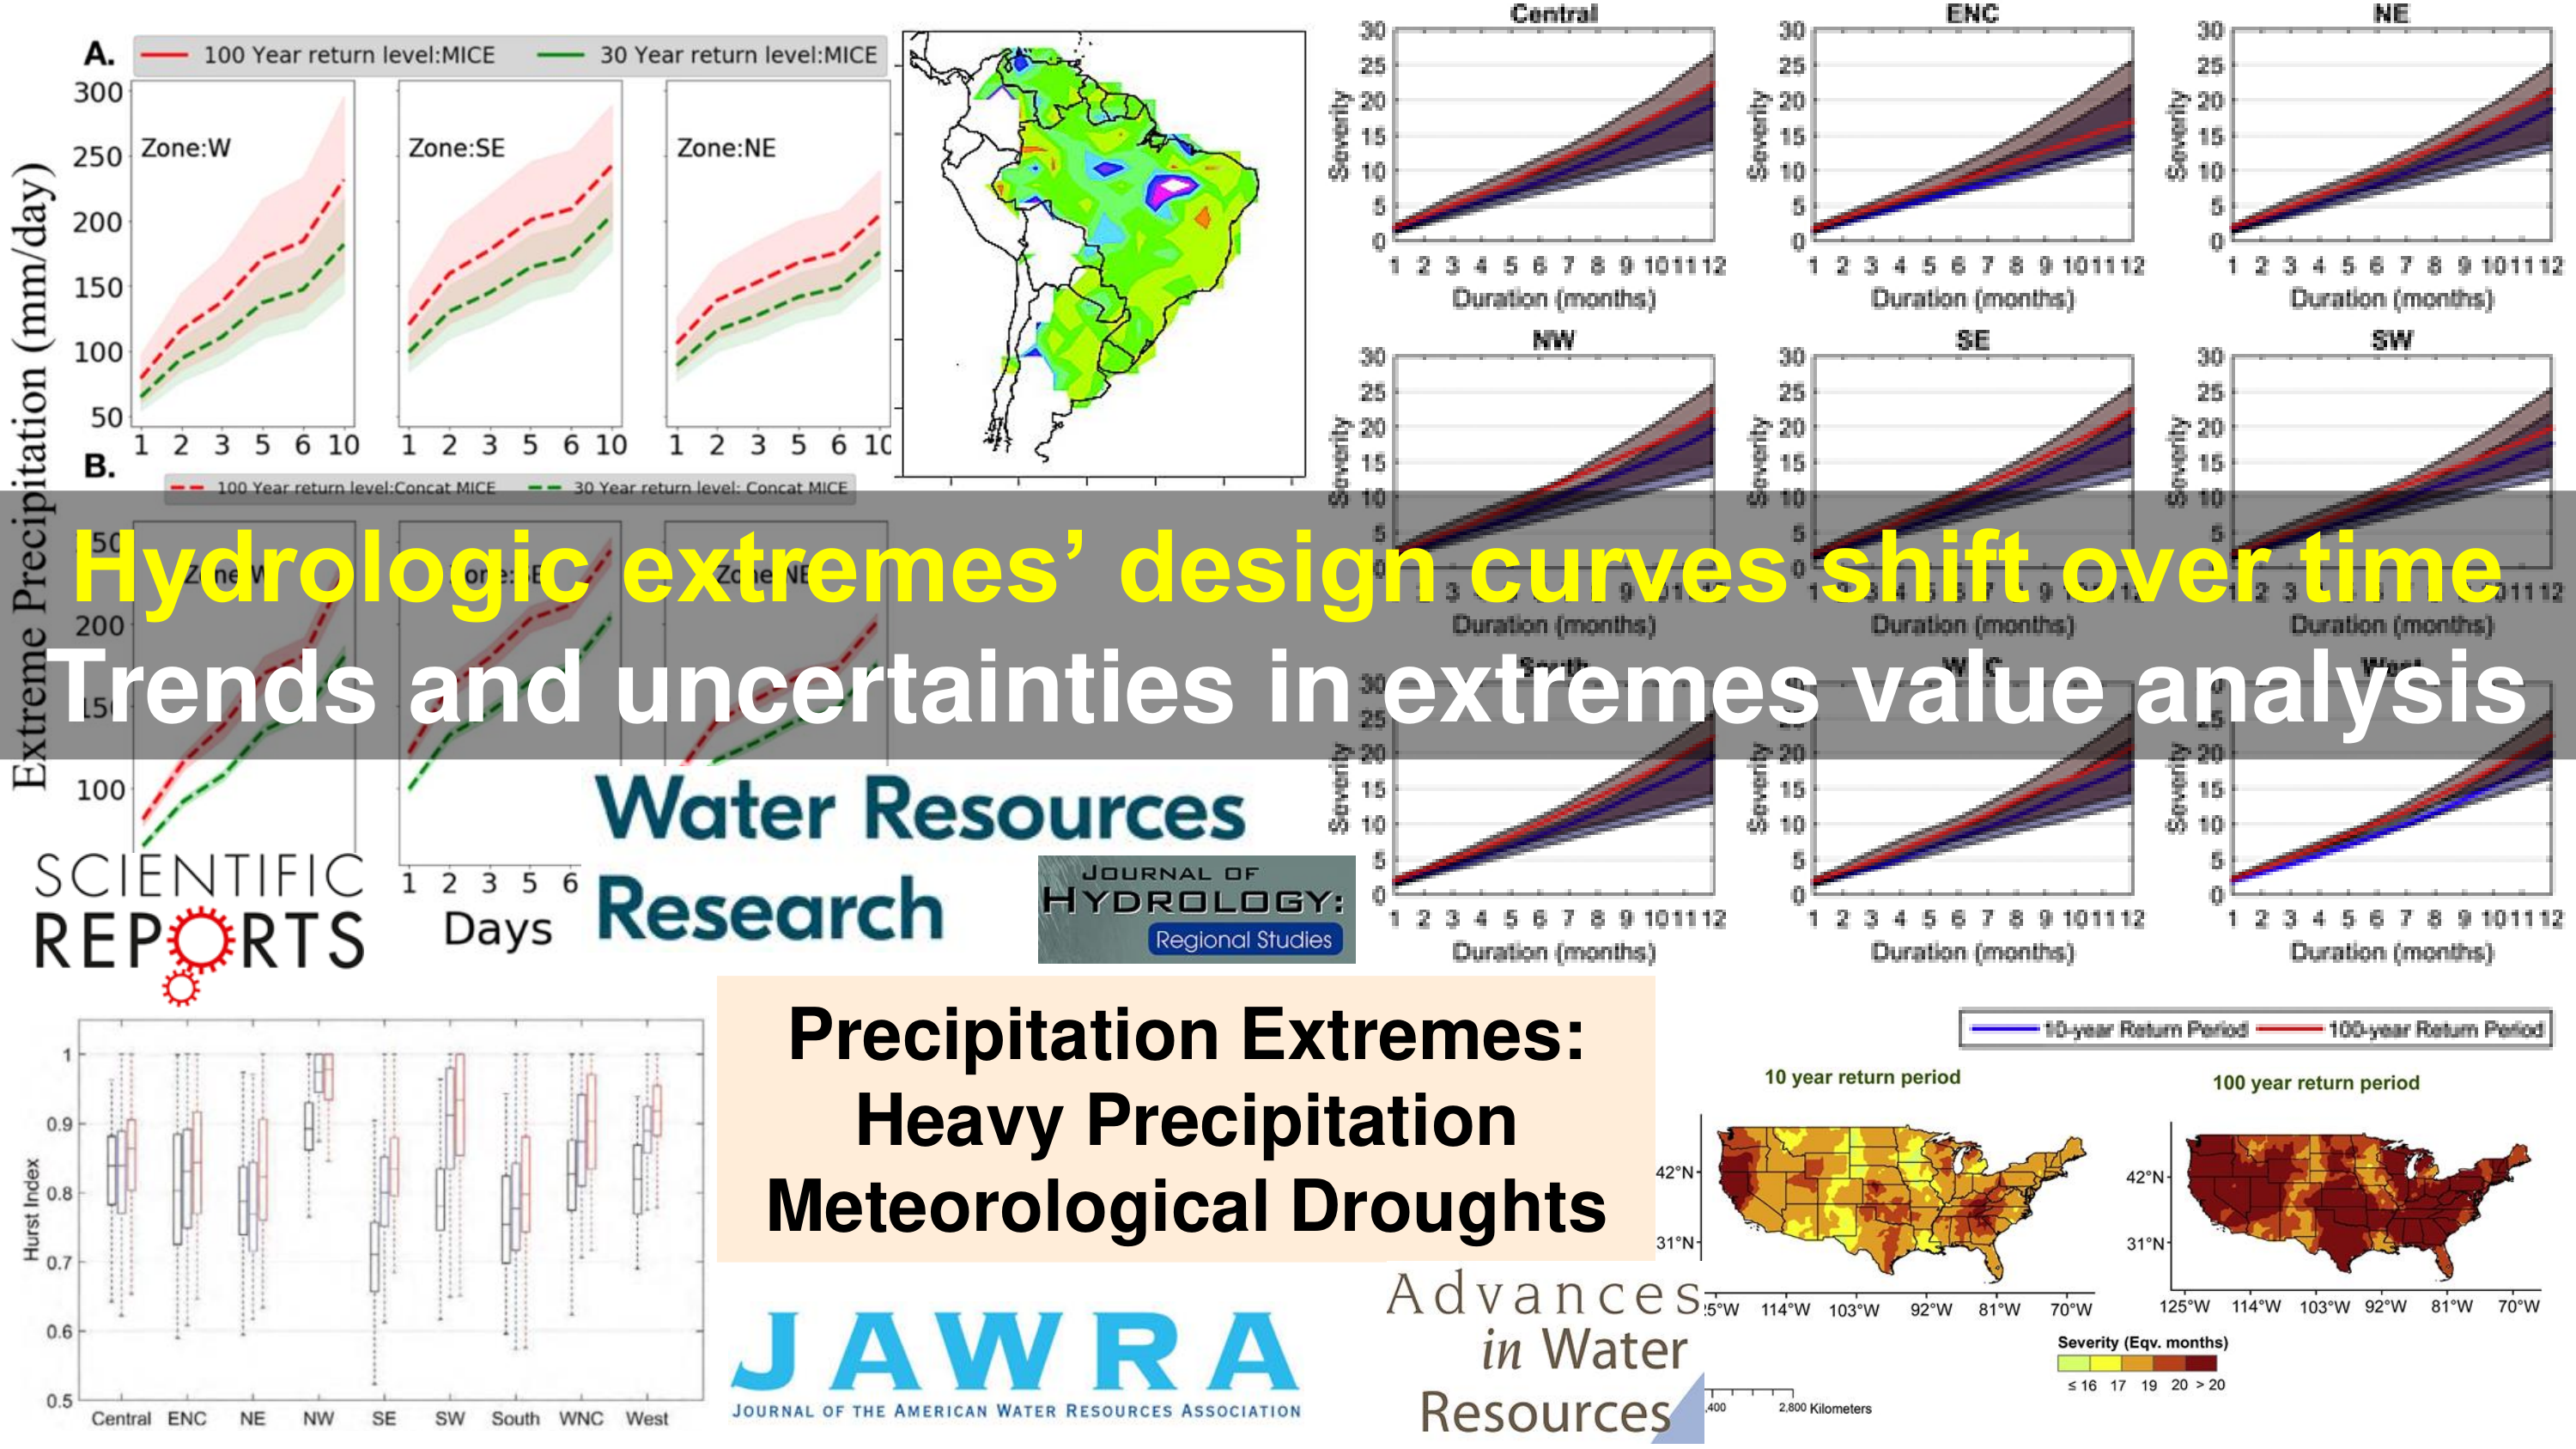
- Slide 9: Hydrometeorological Extremes and Design Curves with Extreme Value Statistics
- SREP paper: Bhatia, U.* and Ganguly, A.R., 2019. Precipitation extremes and depth-duration-frequency under internal climate variability . Scientific Reports, 9(1), 9112.
- JAWRA paper: Ganguli, P.* and Ganguly, A.R., 2016. Robustness of meteorological droughts in dynamically downscaled climate simulations . JAWRA Journal of the American Water Resources Association, 52(1), pp.138-167.
- JH paper: Ganguli, P.* and Ganguly, A.R., 2016. Space-time trends in US meteorological droughts . Journal of Hydrology: Regional Studies, 8, pp.235-259.
- Climate Dynamics paper: Kumar, D.*, Mishra, V.* and Ganguly, A.R., 2015. Evaluating wind extremes in CMIP5 climate models . Climate Dynamics, 45(1), pp.441-453.
- AWR paper: Kuhn, G.*, Khan, S.*, Ganguly, A.R. and Branstetter, M.L., 2007. Geospatial–temporal dependence among weekly precipitation extremes with applications to observations and climate model simulations in South America . Advances in Water Resources, 30(12), pp.2401-2423.
- AWR paper: Malakar, P., Mukherjee, A., Bhanja, S.N., Ganguly, A.R., Ray, R.K., Zahid, A., Sarkar, S., Saha, D. and Chattopadhyay, S., 2021. Three decades of depth-dependent groundwater response to climate variability and human regime in the transboundary Indus-Ganges-Brahmaputra-Meghna mega river basin aquifers . Advances in Water Resources, 149, p.103856.
- WRR paper: Khan, S.*, Kuhn, G.*, Ganguly, A.R., Erickson III, D.J. and Ostrouchov, G., 2007. Spatio‐temporal variability of daily and weekly precipitation extremes in South America . Water Resources Research, 43(11).
- Slide 10: Remote Sensing and Spatiotemporal Machine Learning
- RSE paper: Konduri, V.S.*, Kumar, J., Hargrove, W.W., Hoffman, F.M. and Ganguly, A.R., 2020. Mapping crops within the growing season across the United States . Remote Sensing of Environment, 251, p.112048.
- Frontiers paper: Duffy, K.*, Vandal, T.*, Li, S., Ganguly, S., Nemani, R. and Ganguly, A.R., 2019. DeepEmSat: Deep Emulation for Satellite Data Mining . Frontiers in Big Data, 2, p.42.
- Frontiers paper: Konduri, V.S.*, Vandal, T.J.*, Ganguly, S. and Ganguly, A.R., 2020. Data science for weather impacts on crop yield . Frontiers in Sustainable Food Systems, 4, p.52.
- RSL paper: Collier, E., Mukhopadhyay, S., Duffy, K.*, Ganguly, S., Madanguit, G., Kalia, S., Shreekant, G., Nemani, R., Michaelis, A., Li, S. and Ganguly, A., 2021. Semantic Segmentation of High Resolution Satellite Imagery using Generative Adversarial Networks with Progressive Growing . Remote Sensing Letters, 12(5), pp.439-448.
- Slide 11: Resilience of Regional Transportation Systems with Network Science
- IEEE Transactions ITS paper: Clark, K.L.*, Bhatia, U.*, Kodra, E.A.* and Ganguly, A.R., 2018. Resilience of the US national airspace system airport network . IEEE Transactions on Intelligent Transportation Systems, 19(12), pp.3785-3794.
- PLOS ONE paper: Bhatia, U.*, Kumar, D.*, Kodra, E.* and Ganguly, A.R., 2015. Network science based quantification of resilience demonstrated on the indian railways network . PLOS ONE, 10(11), p.e0141890.
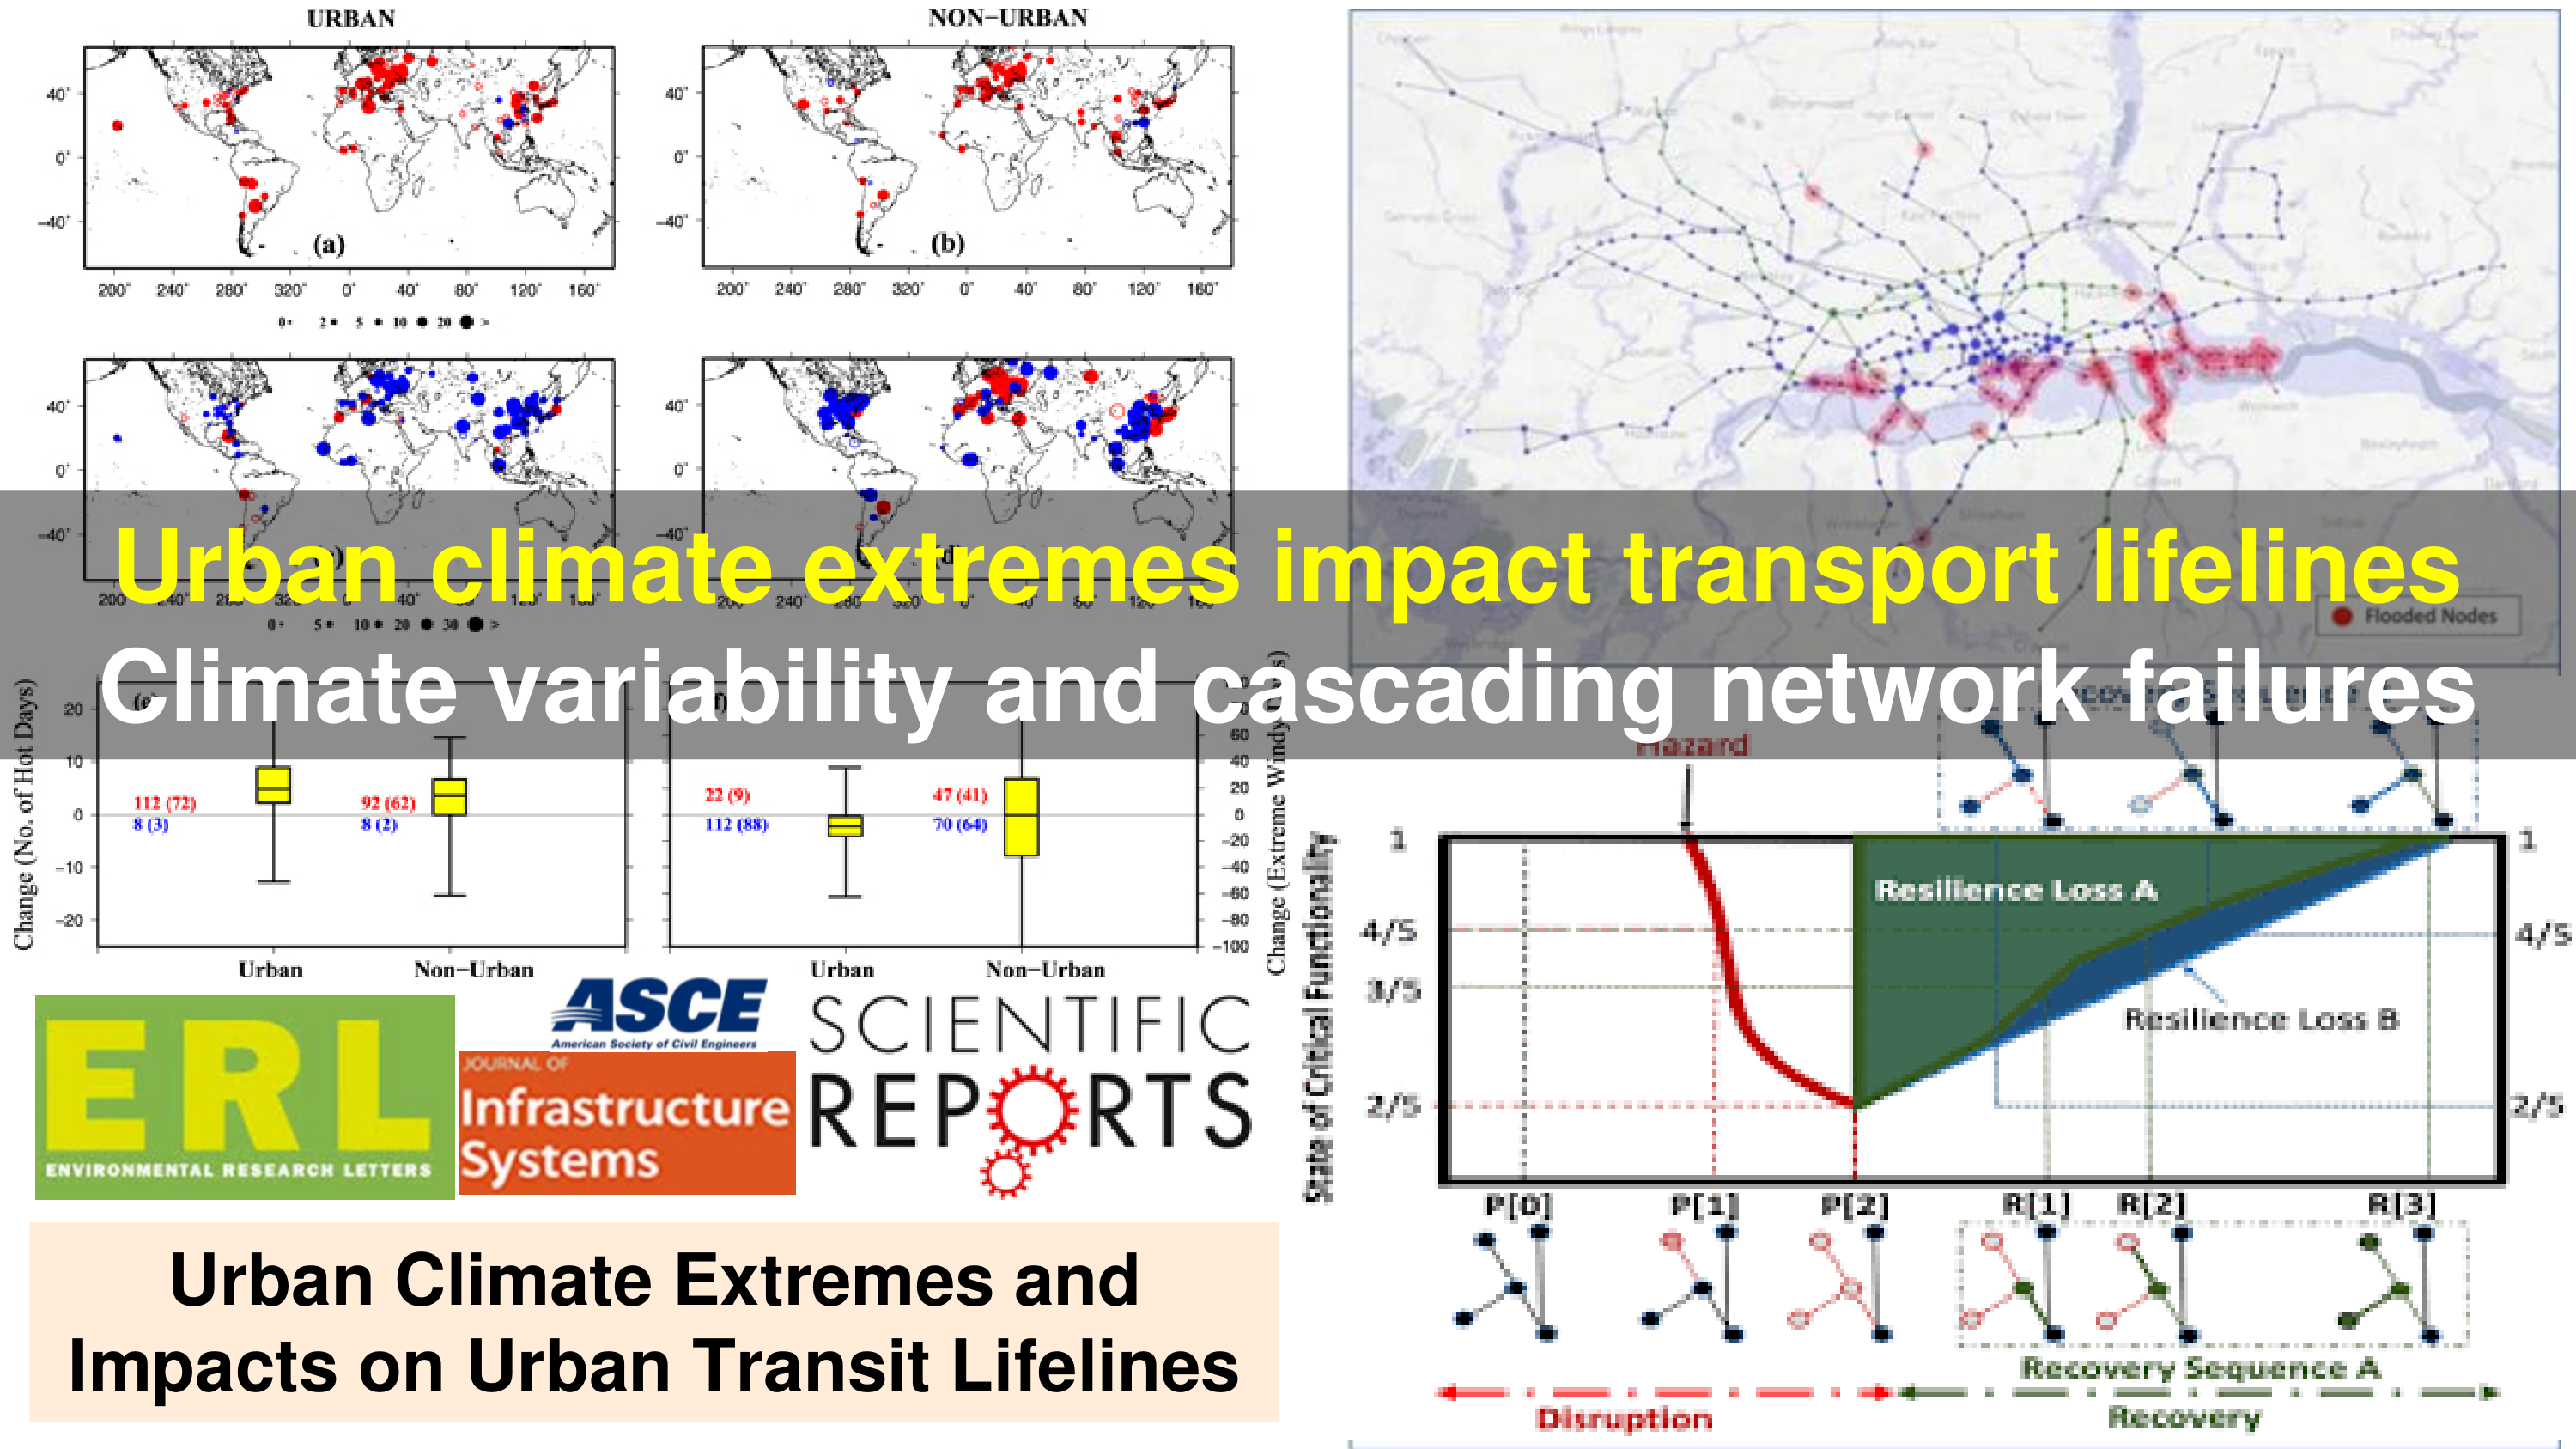
- Slide 12: Urban Climate Extremes and Multi-hazards Transportation Resilience
- SREP paper: Yadav, N.*, Chatterjee, S. and Ganguly, A.R., 2020. Resilience of urban transport network-of-networks under intense flood hazards exacerbated by targeted attacks . Scientific Reports, 10(1), 10350.
- ERL paper: Mishra, V.*, Ganguly, A.R., Nijssen, B. and Lettenmaier, D.P., 2015. Changes in observed climate extremes in global urban areas . Environmental Research Letters, 10(2), p.024005.
- ASCE JIS paper: Bhatia, U.*, Sela, L. and Ganguly, A.R., 2020. Hybrid method of recovery: combining topology and optimization for transportation systems . ASCE Journal of Infrastructure Systems, 26(3), p.04020024.
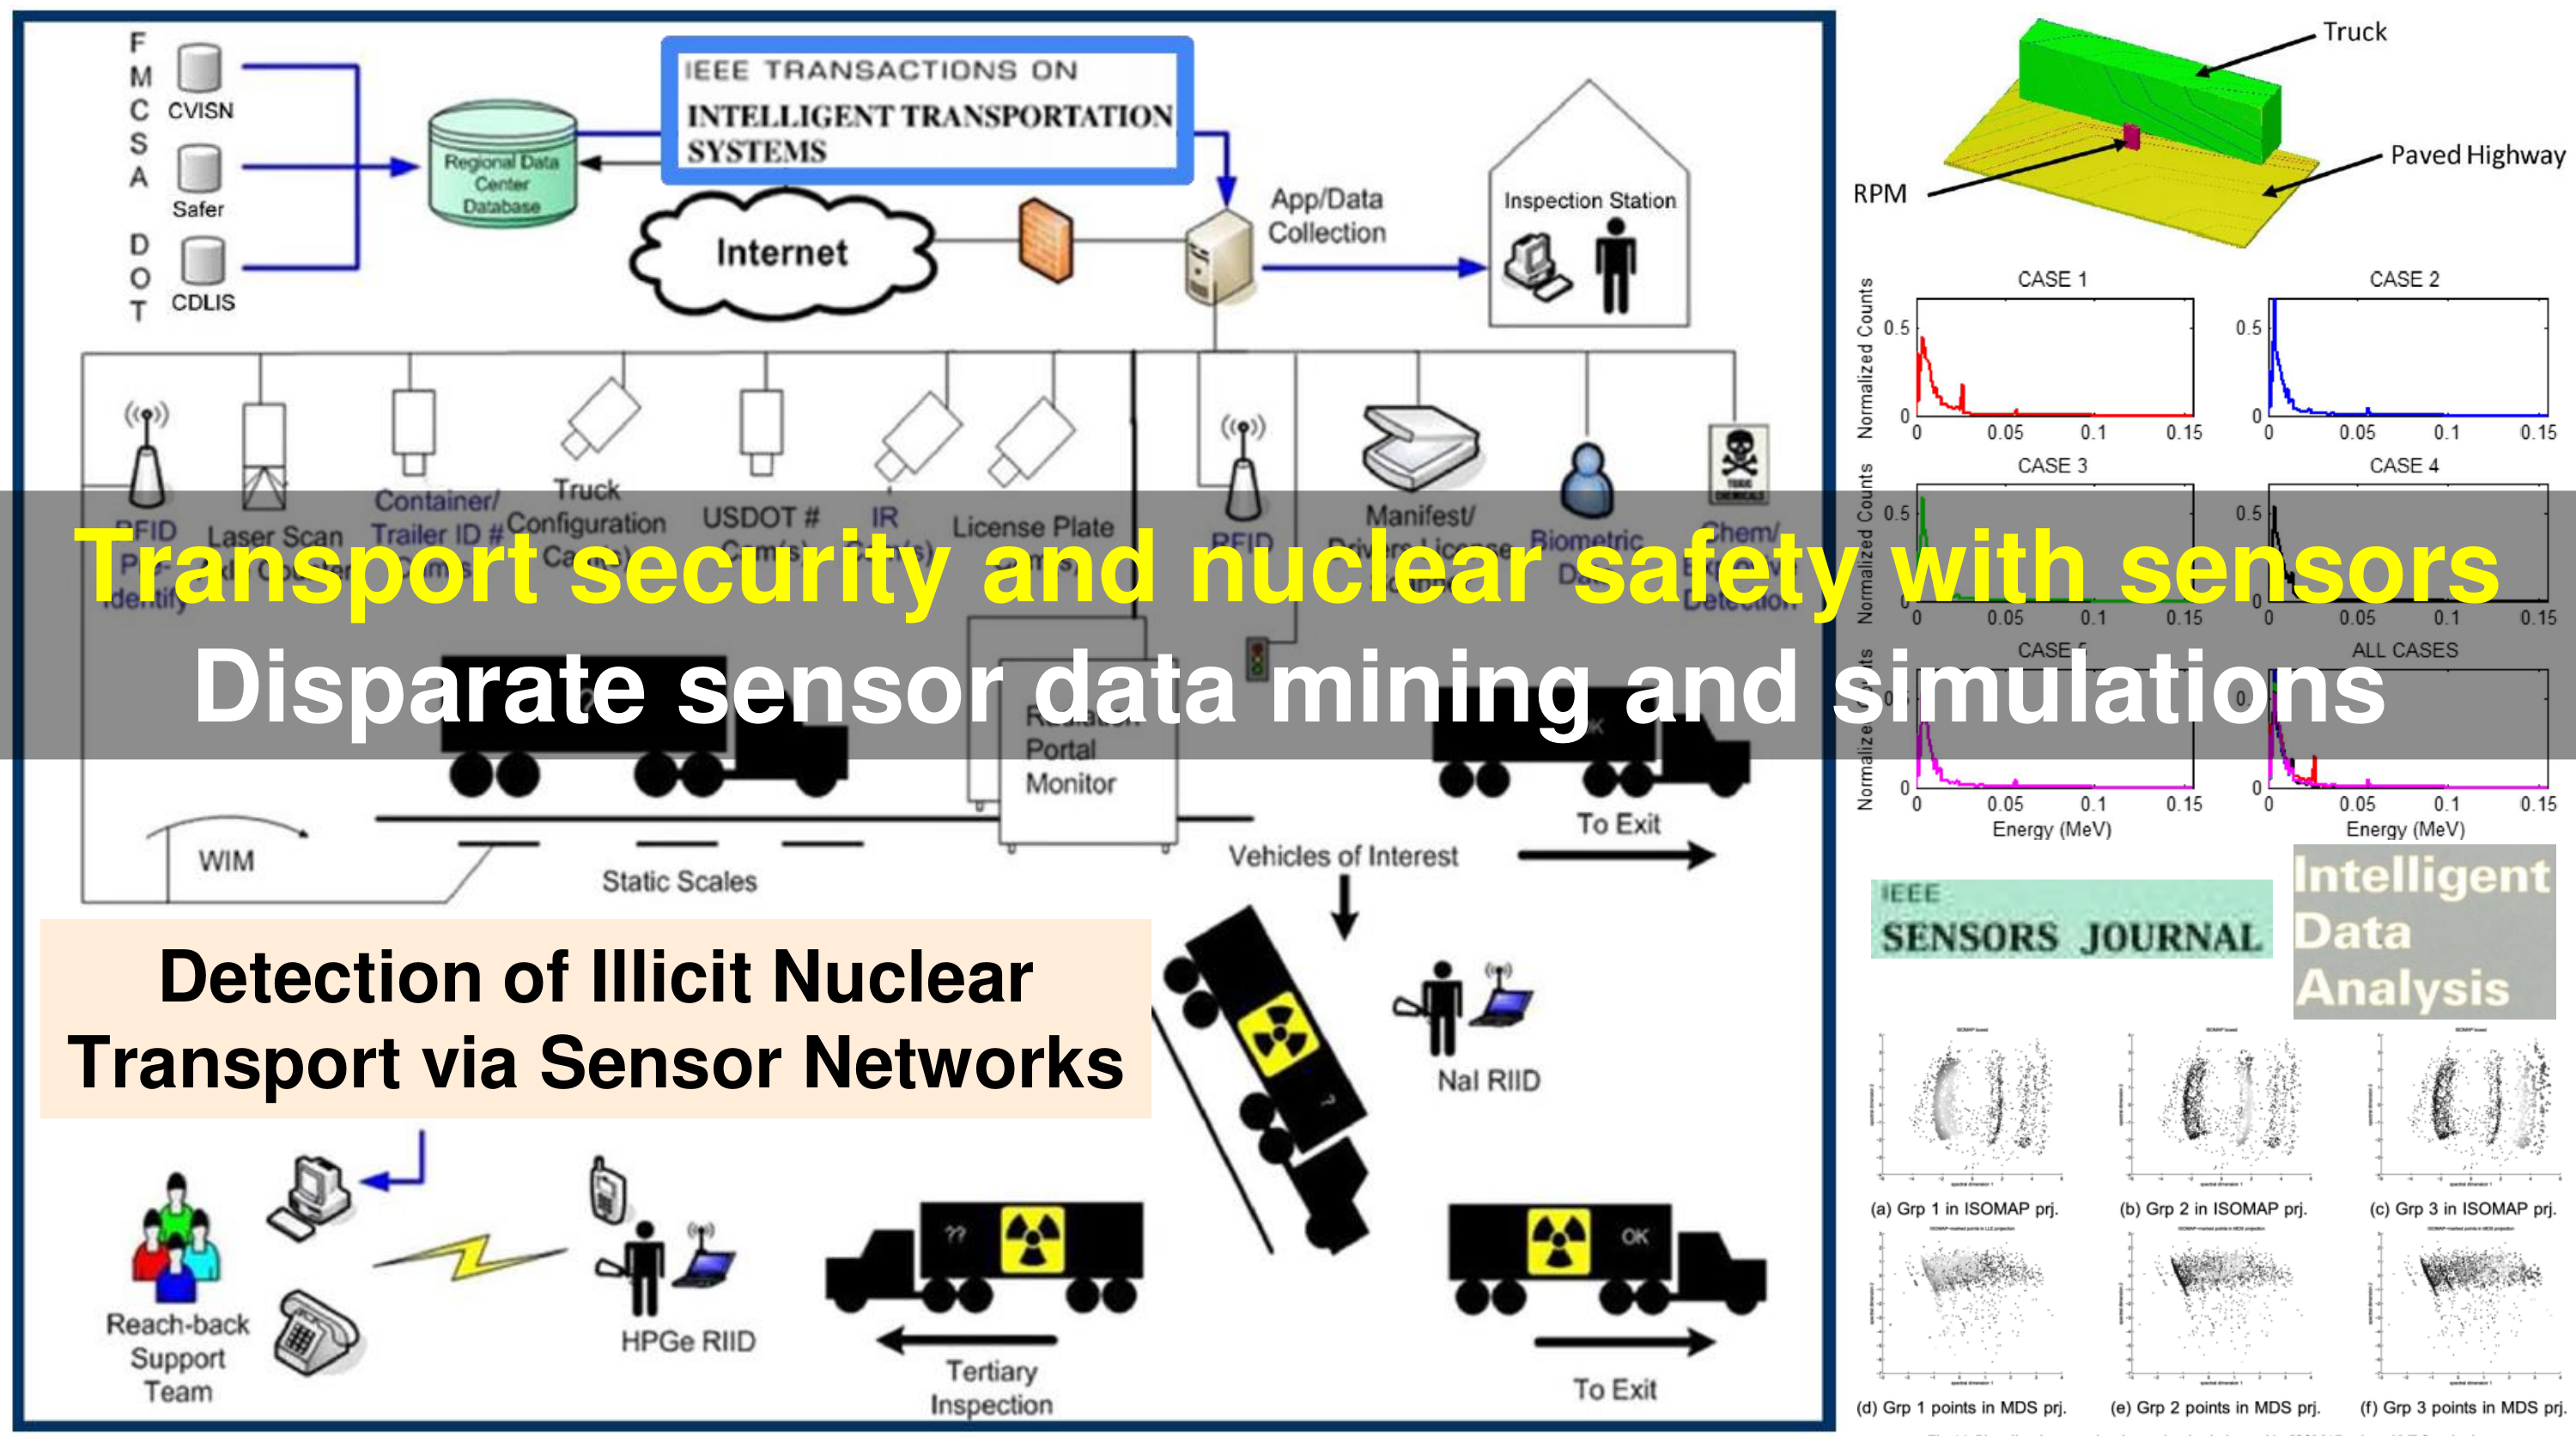
- Slide 13: Transportation Security with Sensor Data Mining
- IEEE Transactions ITS paper: Omitaomu, O.A.*, Ganguly, A.R., Patton, B.W. and Protopopescu, V.A., 2009. Anomaly detection in radiation sensor data with application to transportation security . IEEE Transactions on Intelligent Transportation Systems, 10(2), pp.324-334.
- IDA paper: Agovic, A., Banerjee, A., Ganguly, A. and Protopopescu, V., 2009. Anomaly detection using manifold embedding and its applications in transportation corridors . Intelligent Data Analysis, 13(3), pp.435-455.
- IEEE Sensors paper: Omitaomu, O.A.*, Protopopescu, V.A. and Ganguly, A.R., 2011. Empirical mode decomposition technique with conditional mutual information for denoising operational sensor data . IEEE Sensors Journal, 11(10), pp.2565-2575.
- Slide 14: Physics-Informed Machine Learning and Uncertainty Quantification
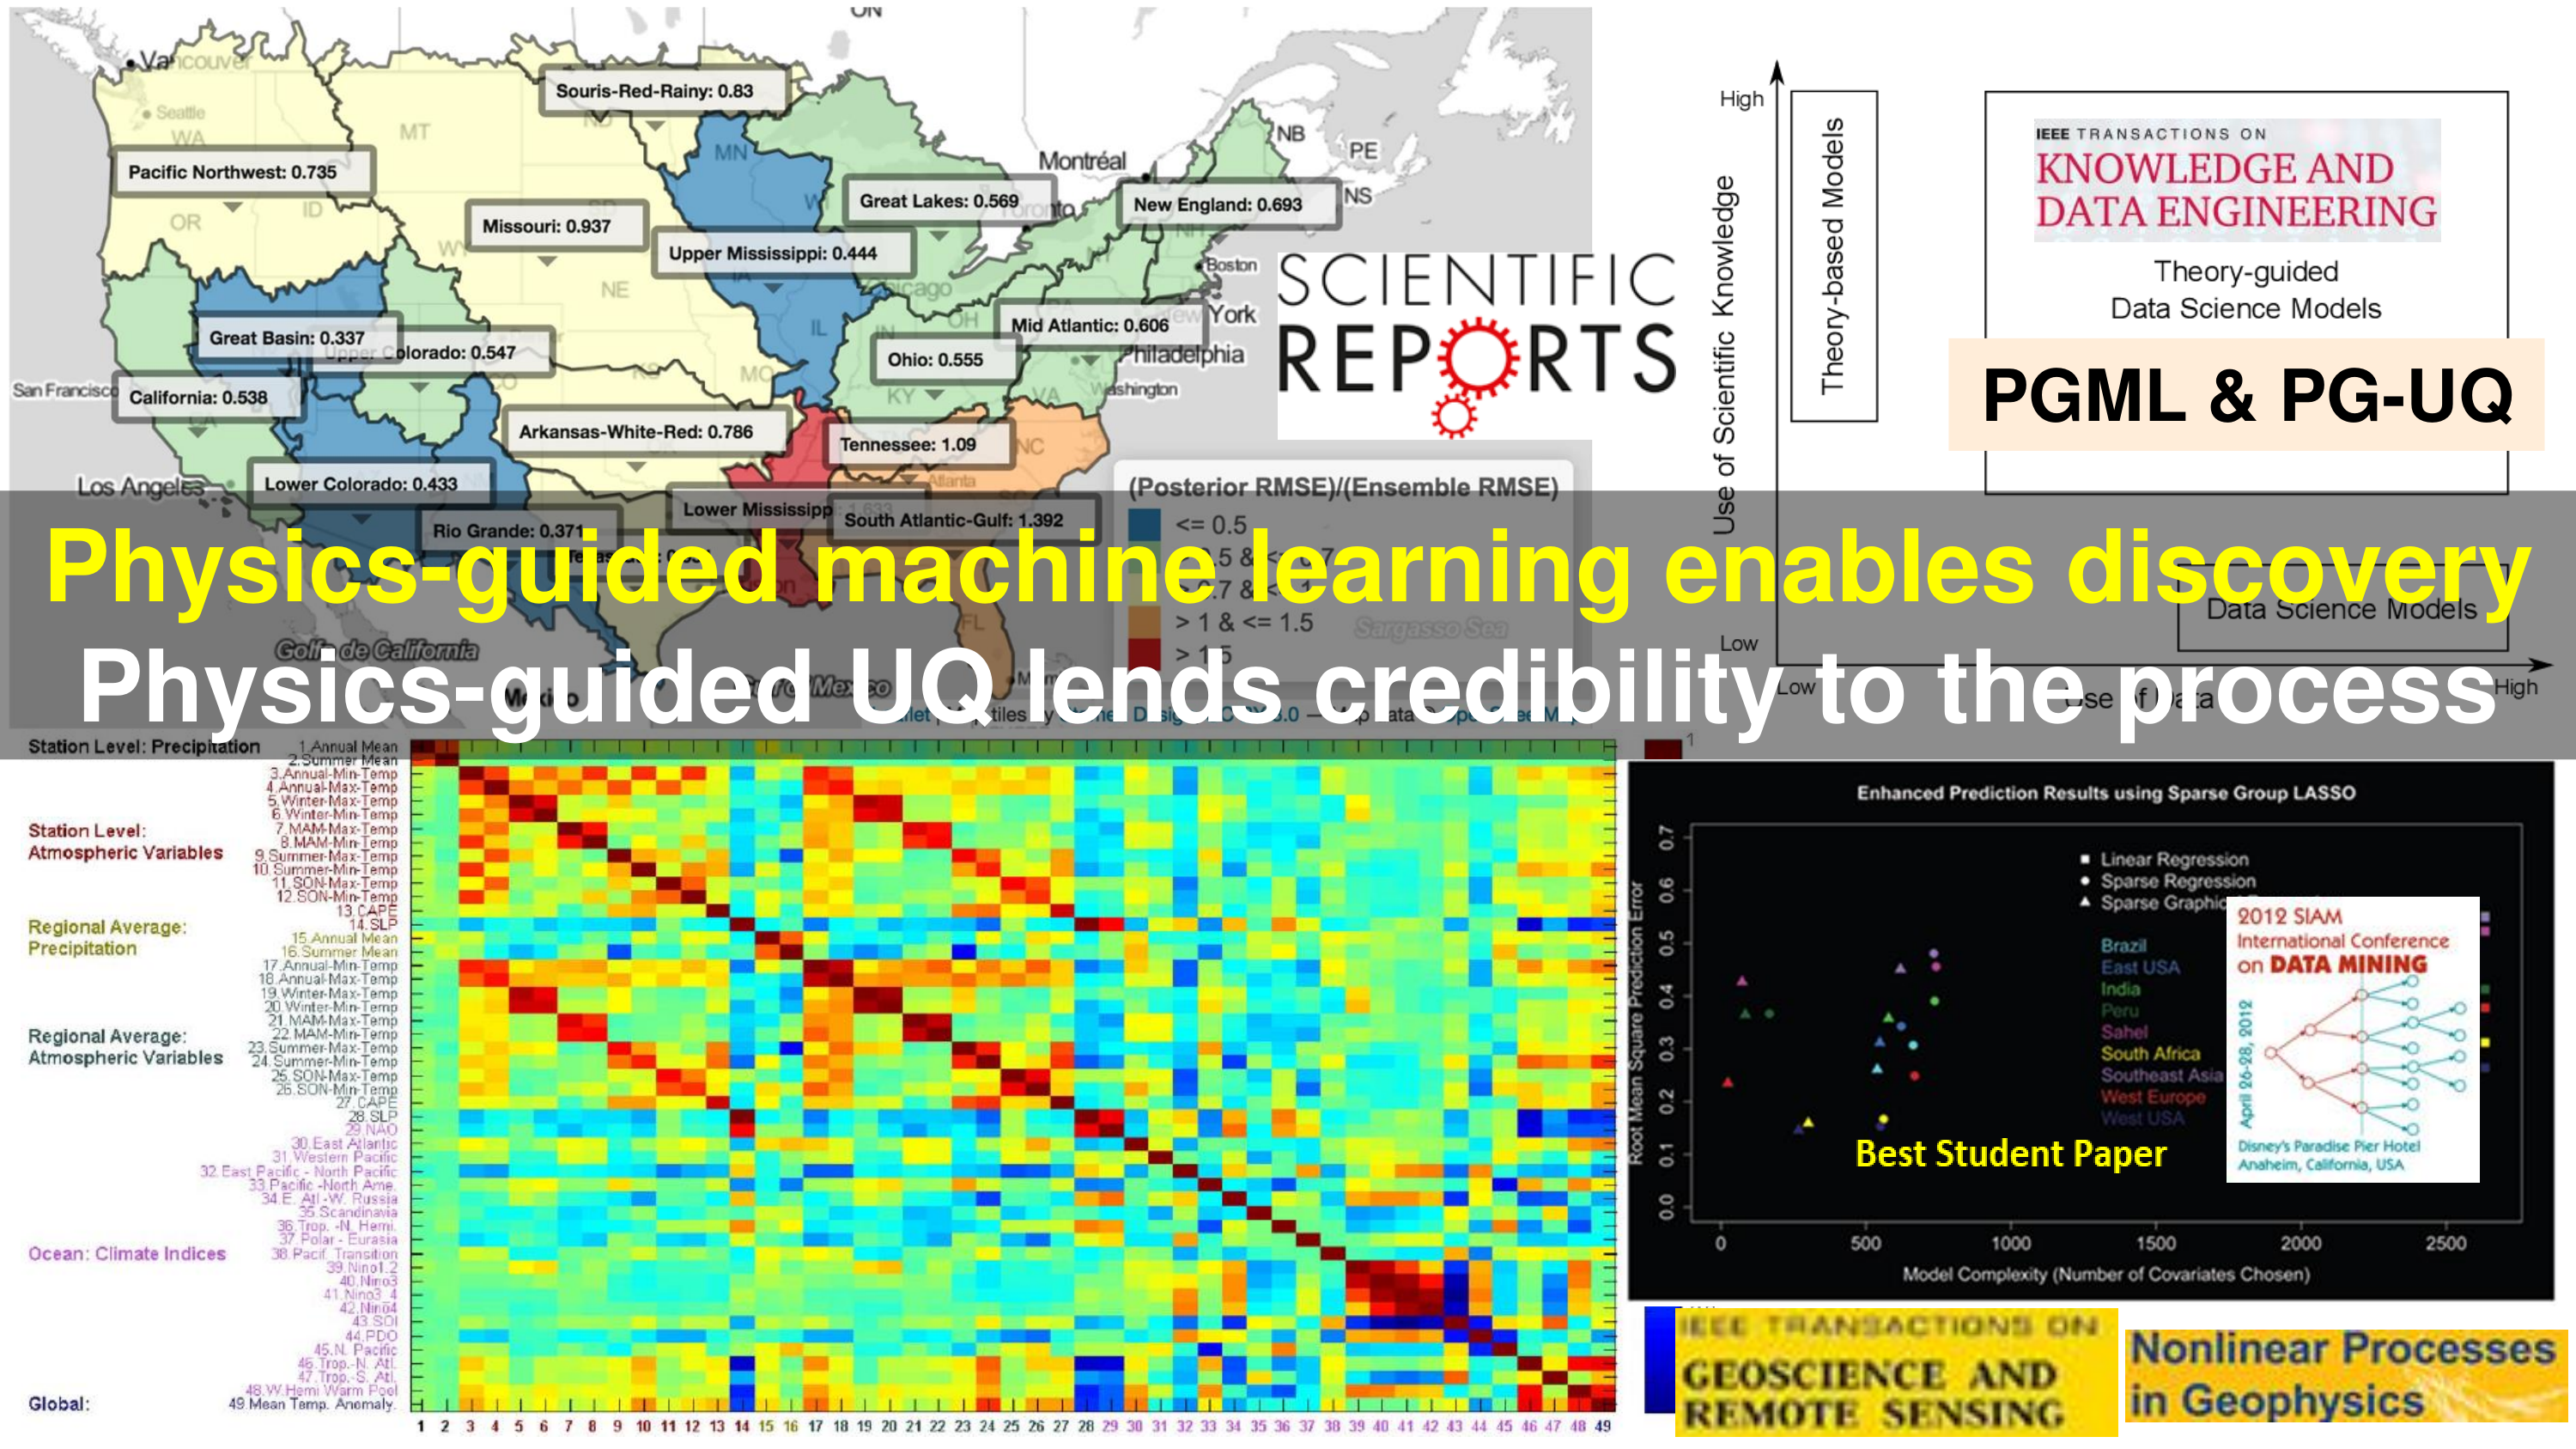
- SREP paper: Kodra, E.*, Bhatia, U.*, Chatterjee, S., Chen, S.* and Ganguly, A.R., 2020. Physics-guided probabilistic modeling of extreme precipitation under climate change . Scientific Reports, 10(1), 10299.
- IEEE Transactions KDE paper: Karpatne, A., Atluri, G., Faghmous, J.H., Steinbach, M., Banerjee, A., Ganguly, A., Shekhar, S., Samatova, N. and Kumar, V., 2017. Theory-guided data science: A new paradigm for scientific discovery from data . IEEE Transactions on Knowledge and Data Engineering, 29(10), pp.2318-2331.
- NPG perspective: Ganguly, A.R., Kodra, E.*, Agrawal, A., Banerjee, A., Boriah, S., Chatterjee, Sn., Chatterjee, So., Choudhary, A., Das, D.*, Faghmous, J., Ganguli, P.*, Ghosh, S., Hayhoe, K., Hays, C., Hendrix, W., Fu, Q., Kawale, J., Kumar, D.*, Kumar, V., Liao, W., Liess, S., Mawalagedara, R.*, Mithal, V., Oglesby, R., Salvi, K., Snyder, P.K., Steinhaeuser, K.*, Wang, D.*, D. Wuebbles (2014): Toward enhanced understanding and projections of climate extremes using physics-guided data mining . Nonlinear Processes in Geophysics, 21, 777-795.
- NPG paper: Das, D.*, Dy, J., Ross, J., Obradovic, Z. and Ganguly, A.R., 2014. Non-parametric Bayesian mixture of sparse regressions with application towards feature selection for statistical downscaling . Nonlinear Processes in Geophysics, 21(6), pp.1145-1157.
- IEEE Transactions GRS paper: Das, D.*, Ganguly, A.R. and Obradovic, Z., 2015. A Bayesian sparse generalized linear model with an application to multiscale covariate discovery for observed rainfall extremes over the United States . IEEE Transactions on Geoscience and Remote Sensing, 53(12), pp.6689-6702.
- SIAM Data Mining paper: Chatterjee, S., Steinhaeuser, K., Banerjee, A., Chatterjee, S. and Ganguly, A., 2012, April. Sparse group lasso: Consistency and climate applications . In Proceedings of the 2012 SIAM International Conference on Data Mining (pp. 47-58). Society for Industrial and Applied Mathematics. Best Student Paper Award.
- Slide 15: Bayesian Deep Learning for Climate Prediction and Uncertainty Quantification
- KDD 2017 paper: Vandal, T.*, Kodra, E.*, Ganguly, S., Michaelis, A., Nemani, R. and Ganguly, A.R., 2017, August. DeepSD: Generating high resolution climate change projections through single image super-resolution . In Proceedings of the 23rd ACM SIGKDD International Conference on Knowledge Discovery and Data Mining (pp. 1663-1672). Runner-up Best Paper Award.
- Nature Comment (citation 2): Joppa, L.N., 2017. The case for technology investments in the environment . Nature 552, 325-328.
- KDD 2018 paper: Vandal, T.*, Kodra, E.*, Dy, J., Ganguly, S., Nemani, R. and Ganguly, A.R., 2018, July. Quantifying uncertainty in discrete-continuous and skewed data with Bayesian Deep Learning . In Proceedings of the 24th ACM SIGKDD International Conference on Knowledge Discovery & Data Mining (pp. 2377-2386).
- IJCAI 2018 paper: Vandal, T.*, Kodra, E.*, Ganguly, S., Michaelis, A., Nemani, R. and Ganguly, A.R., 2018, July. Generating high resolution climate change projections through single image super-resolution: an abridged version . In Proceedings of the 27th International Joint Conference on Artificial Intelligence (pp. 5389-5393).
- Nature Perspective (see Figure 2b and Citation 72): Reichstein, M., Camps-Valls, G., Stevens, B., Jung, M., Denzler, J. and Carvalhais, N., 2019. Deep learning and process understanding for data-driven Earth system science . Nature, 566(7743), pp.195-204.
- KDD 2019 paper: Liu, Y., Chen, J., Ganguly, A. and Dy, J., 2019, July. Nonparametric Mixture of Sparse Regressions on Spatio-Temporal Data--An Application to Climate Prediction . In Proceedings of the 25th ACM SIGKDD International Conference on Knowledge Discovery & Data Mining (pp. 2556-2564).
- KDD 2020 paper: Liu, Y., Ganguly, A.R. and Dy, J., 2020, August. Climate Downscaling Using YNet: A Deep Convolutional Network with Skip Connections and Fusion . In Proceedings of the 26th ACM SIGKDD International Conference on Knowledge Discovery & Data Mining (pp. 3145-3153).
- 2014 KDD-Workshop paper: An, X.*, Ganguly, A.R., Fang, Y., Scyphers, S.B., Hunter, A.M. and Dy, J.G., 2014, August. Tracking climate change opinions from twitter data . In ACM KDD Workshop on Data Science for Social Good (pp. 1-6).
- 2020 KDD-Workshop paper: Yadav, N.*, Ravela, S. and Ganguly, A.R., 2020. Machine Learning for Robust Identification of Complex Nonlinear Dynamical Systems: Applications to Earth Systems Modeling . In ACM KDD Workshop on Fragile Earth.
- Slide 16: Broader Implications for Societal Grand Challenges
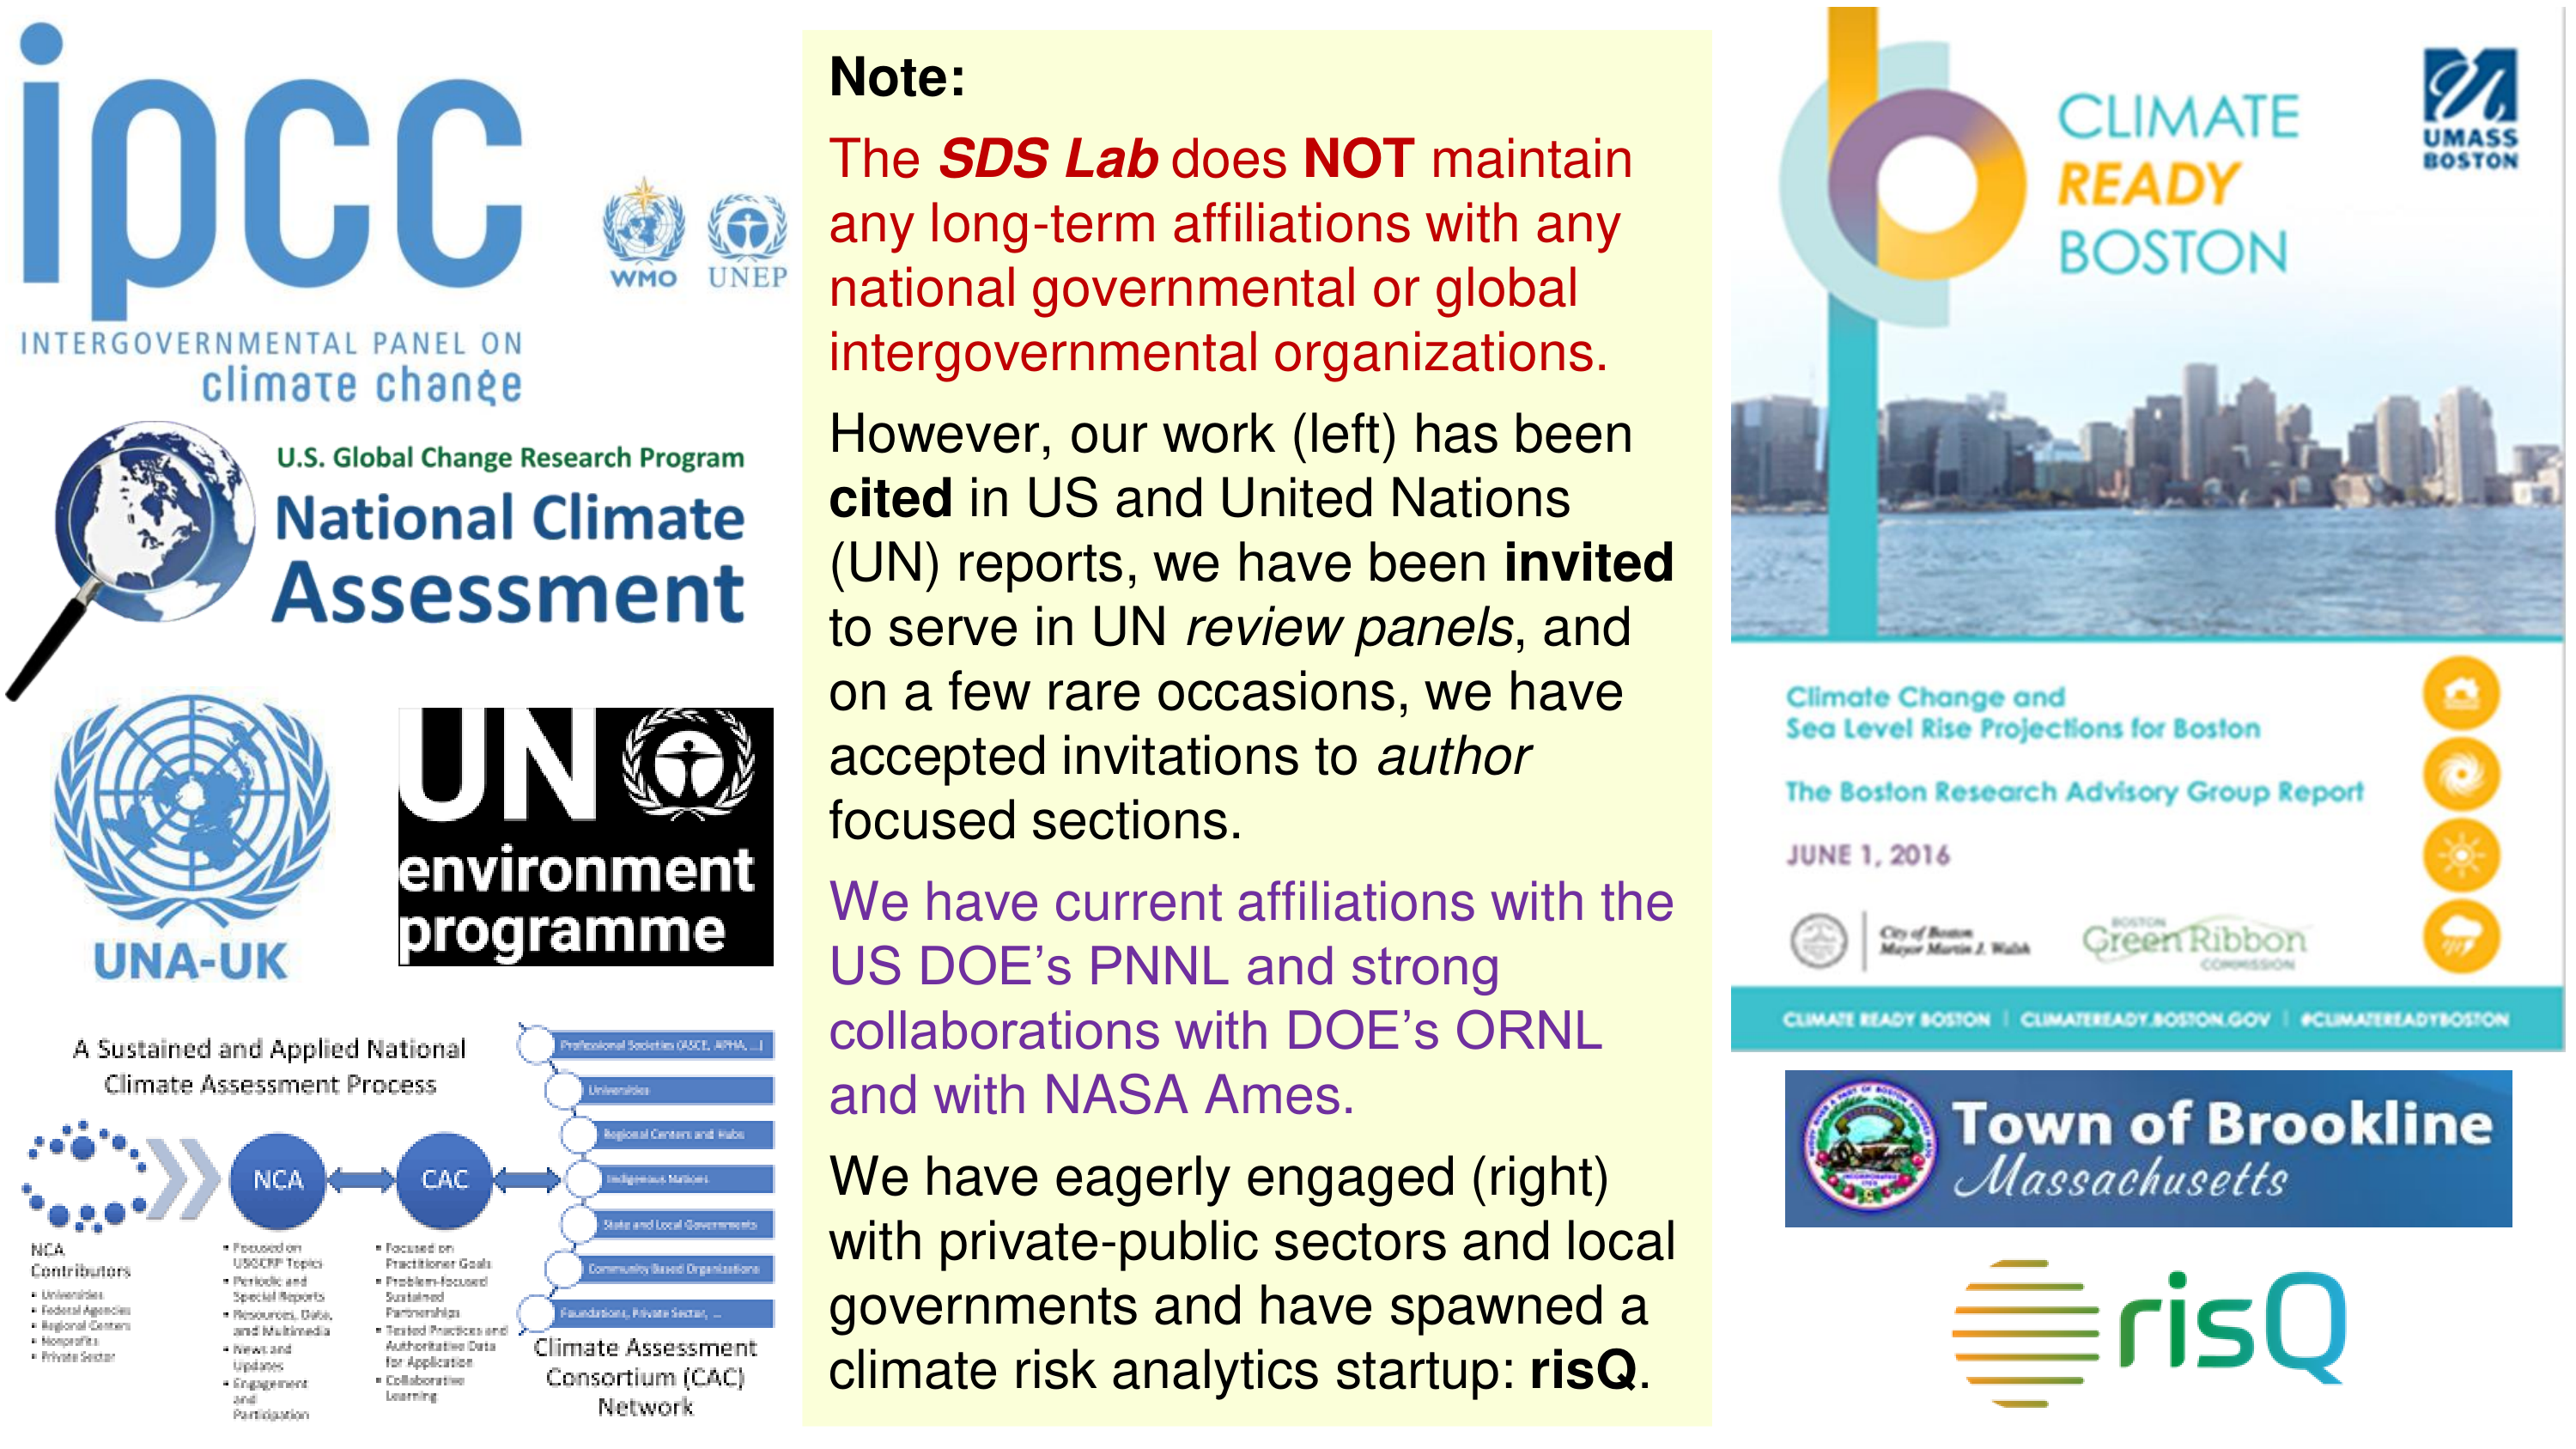
- Climate Ready Boston (City of Boston): 2016 BRAG Report (Temperature Extremes section)
- Thriving Earth Exchange (Town of Brookline, MA, and AGU): TEX Project; NU News on Award-Winning Poster
- Primary Experiential Partners: NASA; US DOE's ORNL and PNNL; startup risQ
- Regulatory Principles under Climate Uncertainty: Buffalo Law Review
- Climate 2020 (United Nations Association of the United Kingdom): Data-Driven Solutions
- US Sustained National Climate Assessment (Lead of AI section): SCAN website; Full Report; Summary; Nature News
- United Nations (UN) Assessments: Cited in IPCC AR5; IPCC SR15; see also SREX quotes (Boston Globe; CBC; CBS)
- US National Assessments: Cited in US NCA4 (Vol. I and Vol. II)
- Climate Extremes and Impacts in India: Heat Waves; Heavy Precipitation; Kolkata US Consulate; VAIBHAV Summit (multiple panels in climate, hydrology, AI)
- Artificial Intelligence Program Committees: AAAI-21; KDD 2020; KDD 2021; Fragile Earth (workshop with KDD)
- Editorial Boards and Societal Committees: PLOS ONE; Scientific Reports (Nature Research); Specialty Chief Editor (Frontiers); ASCE Climate Adaptation (Committee); ASCE Convention (Keynote) ASCE JCCE (past); AMS AI Committee (past); AGU Water Resources Research (past)
- UN Review Panel (Ozone Depletion and Climate Change): 2010 Assessment; 2018 Assessment; NU News
For a full list of publications, visit the PI’s Google Scholar page here.
US Patents
- US Patent on Climate Risk Analytics
- Title: System for multivariable climate change forecasting with uncertainty quantification
- US Patent Number: US Patent Number: 10488556
- Inventors: Evan Kodra*, Auroop R. Ganguly
- Assignee: Northeastern University, Boston, MA (NU News)
- Date granted: November 26, 2019
- US Patent on Infrastructure Network Resilience
- Title: System for networking and analyzing geospatial data, human infrastructure, and natural elements
- US Patent Number: US Patent Number: 10361907
- Inventors: Udit Bhatia*, Devashish Kumar*, Evan Kodra*, Auroop R. Ganguly
- Assignee: Northeastern University, Boston, MA (NU News)
- Date granted: July 23, 2019